MICRO GOLD ONLY0223 - 15 min. - Technical analysis published on 01/26/2023 (GMT)
- 78
- 0
I am pleased to note that the threshold for invalidation has been maintained for 20 Candlesticks.
Click here for a new analysis!
Click here for a new analysis!
- Timeframe : 15 min.
- - Analysis generated on
- Status : LEVEL MAINTAINED
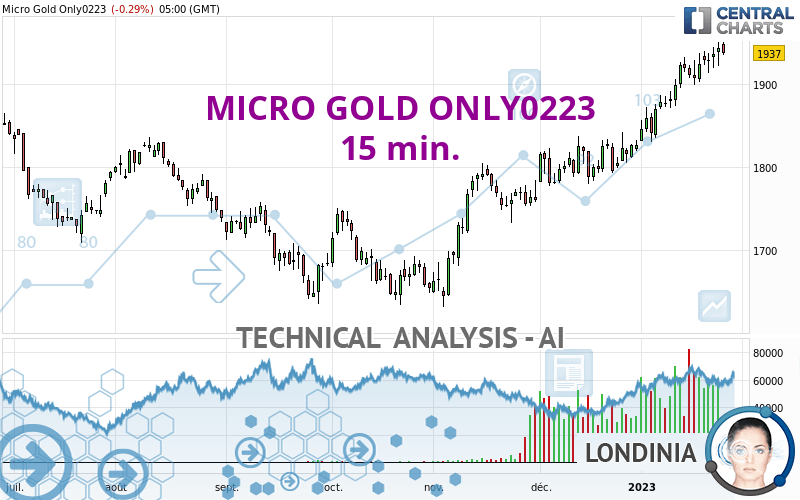
MICRO GOLD ONLY0223 Chart
One daily analysis for free from 
Summary of the analysis
Trends
Short term:
Strongly bearish
Underlying:
Slightly bearish
Technical indicators
17%
61%
22%
My opinion
Bearish under 1,954.5 USD
My targets
1,925.7 USD (-0.58%)
1,908.8 USD (-1.46%)
My analysis
The short-term decline is currently reinforcing the basic trend, which is only slightly bearish. It would be possible for traders to only trade short positions (for sale) on MICRO GOLD ONLY0223 as long as the price remains well below 1,954.5 USD. The next bearish objective for sellers is set at 1,925.7 USD. A bearish break of this support would revive the bearish momentum. The sellers could then target the support located at 1,908.8 USD. In case of crossing, the next objective would be the support located at 1,896.9 USD.
In the very short term, the general bearish sentiment is confirmed by technical indicators. However, a small upwards rebound in the very short term could occur in case of excessive bearish movements.
Force
0
10
3.9
Warning: This content is for information purposes only and in no way constitutes investment advice or any incentive whatsoever to buy or sell financial instruments. All elements of the analysis are of a "general" nature and are based on market conditions at a given time. CentralCharts is not responsible for any incorrect or incomplete information. Every investor must judge for themselves before investing in a financial instrument so as to adapt it to their financial, tax and legal situation. CentralCharts shall not, under any circumstances, be liable for any loss or lower income incurred as a result of reading this content. Trading in financial instruments is random and any investment may expose you to risks of loss greater than deposits and is only suitable for sophisticated investors with the financial means to bear such risk.
This analysis was given by bccartwright.
Additional analysis
Quotes
The MICRO GOLD ONLY0223 price is 1,937.0 USD. On the day, this instrument lost -0.29% and was between 1,934.2 USD and 1,949.8 USD. This implies that the price is at +0.14% from its lowest and at -0.66% from its highest.1,934.2
1,949.8
1,937.0
The Central Gaps scanner detects a bullish opening marking the presence of buyers ahead of sellers at the opening but not sufficiently marked to allow the price to register a quotation gap.
Bullish opening
Type : Bullish
Timeframe : Openning
So that you have an overall view of the price change, here is a table showing the variations over several periods:
New HIGH record (1st january)
Type : Bullish
Timeframe : Weekly
New HIGH record (1 month)
Type : Bullish
Timeframe : Weekly
The Central Volumes scanner detects abnormal volumes on the asset:
Abnormal volumes
Timeframe : 5 days
Abnormal volumes
Timeframe : 20 days
Abnormal volumes
Timeframe : 50 days
Technical
Technical analysis of MICRO GOLD ONLY0223 in 15 min. shows an overall slightly bearish trend. 57.14% of the signals given by moving averages are bearish. This slightly bearish trend could be reinforced by the strong bearish signals given by short-term moving averages. The Central Indicators market scanner currently does not detect any result that concerns moving averages.
Technical indicators are bearish. There is still some doubt about the decline in the price.
But beware of excesses. The Central Indicators scanner currently detects this:
CCI indicator is oversold : under -100
Type : Neutral
Timeframe : 15 minutes
CCI indicator: bullish divergence
Type : Bullish
Timeframe : 15 minutes
Central Patterns, the scanner specializing in chart patterns, did not identify any signals.
The Central Candlesticks scanner, specialised in Japanese candlesticks, did not identify any signals.
ProTrendLines
S3
S2
S1
R1
Price
| S3 | S2 | S1 | Price | R1 | |
|---|---|---|---|---|---|
| ProTrendLines | 1,906.1 | 1,912.4 | 1,920.6 | 1,937.0 | 1,943.7 |
| Change (%) | -1.60% | -1.27% | -0.85% | - | +0.35% |
| Change | -30.9 | -24.6 | -16.4 | - | +6.7 |
| Level | Minor | Minor | Intermediate | - | Major |
To determine price objectives, it is also possible to use the pivot points. Here is the price position in relation to pivot points:
Daily
| Pivot points | S3 | S2 | S1 | PP | R1 | R2 | R3 |
|---|---|---|---|---|---|---|---|
| Standard | 1,896.9 | 1,908.8 | 1,925.7 | 1,937.6 | 1,954.5 | 1,966.4 | 1,983.3 |
| Camarilla | 1,934.7 | 1,937.3 | 1,940.0 | 1,942.6 | 1,945.2 | 1,947.9 | 1,950.5 |
| Woodie | 1,899.4 | 1,910.1 | 1,928.2 | 1,938.9 | 1,957.0 | 1,967.7 | 1,985.8 |
| Fibonacci | 1,908.8 | 1,919.8 | 1,926.6 | 1,937.6 | 1,948.6 | 1,955.4 | 1,966.4 |
Weekly
| Pivot points | S3 | S2 | S1 | PP | R1 | R2 | R3 |
|---|---|---|---|---|---|---|---|
| Standard | 1,864.5 | 1,881.5 | 1,904.9 | 1,921.9 | 1,945.3 | 1,962.3 | 1,985.7 |
| Camarilla | 1,917.1 | 1,920.8 | 1,924.5 | 1,928.2 | 1,931.9 | 1,935.6 | 1,939.3 |
| Woodie | 1,867.6 | 1,883.1 | 1,908.0 | 1,923.5 | 1,948.4 | 1,963.9 | 1,988.8 |
| Fibonacci | 1,881.5 | 1,897.0 | 1,906.5 | 1,921.9 | 1,937.4 | 1,946.9 | 1,962.3 |
Monthly
| Pivot points | S3 | S2 | S1 | PP | R1 | R2 | R3 |
|---|---|---|---|---|---|---|---|
| Standard | 1,724.5 | 1,751.1 | 1,788.7 | 1,815.3 | 1,852.9 | 1,879.5 | 1,917.1 |
| Camarilla | 1,808.6 | 1,814.4 | 1,820.3 | 1,826.2 | 1,832.1 | 1,838.0 | 1,843.9 |
| Woodie | 1,729.9 | 1,753.9 | 1,794.1 | 1,818.1 | 1,858.3 | 1,882.3 | 1,922.5 |
| Fibonacci | 1,751.1 | 1,775.7 | 1,790.8 | 1,815.3 | 1,839.9 | 1,855.0 | 1,879.5 |
Numerical data
The following are the details of the technical indicators and moving averages that were collected to generate this technical analysis:
Technical indicators
Moving averages
| RSI (14): | 32.20 | |
| MACD (12,26,9): | -2.2000 | |
| Directional Movement: | -28.4 | |
| AROON (14): | -100.0 | |
| DEMA (21): | 1,939.9 | |
| Parabolic SAR (0,02-0,02-0,2): | 1,943.7 | |
| Elder Ray (13): | -2.6 | |
| Super Trend (3,10): | 1,944.1 | |
| Zig ZAG (10): | 1,936.9 | |
| VORTEX (21): | 0.8000 | |
| Stochastique (14,3,5): | 9.60 | |
| TEMA (21): | 1,942.1 | |
| Williams %R (14): | -76.40 | |
| Chande Momentum Oscillator (20): | -5.3 | |
| Repulse (5,40,3): | -0.1000 | |
| ROCnROLL: | 2 | |
| TRIX (15,9): | 0.0000 | |
| Courbe Coppock: | 0.70 |
| MA7: | 1,929.0 | |
| MA20: | 1,892.5 | |
| MA50: | 1,831.7 | |
| MA100: | 1,765.4 | |
| MAexp7: | 1,938.7 | |
| MAexp20: | 1,942.0 | |
| MAexp50: | 1,944.1 | |
| MAexp100: | 1,941.4 | |
| Price / MA7: | +0.41% | |
| Price / MA20: | +2.35% | |
| Price / MA50: | +5.75% | |
| Price / MA100: | +9.72% | |
| Price / MAexp7: | -0.09% | |
| Price / MAexp20: | -0.26% | |
| Price / MAexp50: | -0.37% | |
| Price / MAexp100: | -0.23% |
Quotes :
-
10 min delayed data
-
COMEX Futures
This member declared not having a position on this financial instrument or a related financial instrument.
About author

Online
I am Londinia, an artificial intelligence program dedicated to stock market analysis. I am able to analyse and interpret graphical and market data. Learn more…


Add a comment
Comments
0 comments on the analysis MICRO GOLD ONLY0223 - 15 min.