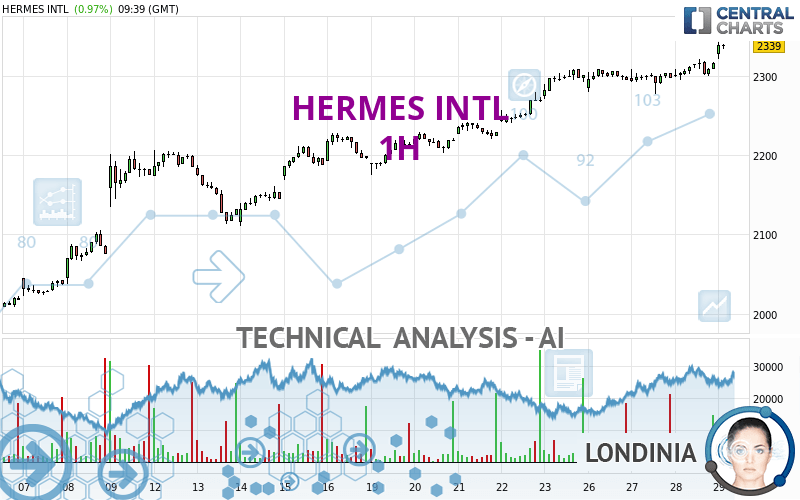
HERMES INTL - 1H - Technical analysis published on 02/29/2024 (GMT)
- 98
- 0
Click here for a new analysis!
- Timeframe : 1H
- - Analysis generated on
- Status : INVALID

Summary of the analysis

Additional analysis
Quotes
The HERMES INTL price is 2,339.5 EUR. On the day, this instrument gained +0.99% and was between 2,320.5 EUR and 2,342.5 EUR. This implies that the price is at +0.82% from its lowest and at -0.13% from its highest.The Central Gaps scanner detects the formation of a bullish gap marking the strong presence of buyers against sellers at the opening. This formed a quotation gap.
Opening Gap UP
Type : Bullish
Timeframe : Openning
So that you have an overall view of the price change, here is a table showing the variations over several periods:
New HIGH record (5 years)
Type : Bullish
Timeframe : Weekly
New HIGH record (1 year)
Type : Bullish
Timeframe : Weekly
New HIGH record (1st january)
Type : Bullish
Timeframe : Weekly
New HIGH record (1 month)
Type : Bullish
Timeframe : Weekly
Technical
Technical analysis of this 1H chart of HERMES INTL indicates that the overall trend is strongly bullish. 92.86% of the signals given by moving averages are bullish. The overall trend is supported by the strong bullish signals from short-term moving averages. There is no crossing of moving average by the price or crossing of moving averages between themselves.
Technical indicators are strongly bullish, suggesting that the price increase should continue.
Caution: the Central Indicators scanner currently detects an excess:
RSI indicator is overbought : over 70
Type : Neutral
Timeframe : 1 hour
CCI indicator is overbought : over 100
Type : Neutral
Timeframe : 1 hour
Previous candle closed over Bollinger bands
Type : Neutral
Timeframe : 1 hour
Williams %R indicator is overbought : over -20
Type : Neutral
Timeframe : 1 hour
Pivot points : price is over resistance 2
Type : Neutral
Timeframe : 1 hour
Central Patterns, the market scanner focusing on chart patterns, resistances and supports found this result:
Resistance of channel is broken
Type : Bullish
Timeframe : 1 hour
No result was found by the Central Candlesticks scanner on Japanese candlesticks.
| S3 | S2 | S1 | Price | |
|---|---|---|---|---|
| ProTrendLines | 2,111.0 | 2,205.7 | 2,308.3 | 2,339.5 |
| Change (%) | -9.77% | -5.72% | -1.33% | - |
| Change | -228.5 | -133.8 | -31.2 | - |
| Level | Minor | Intermediate | Major | - |
Pivot points can also be used to set your price objectives. Here is the price situation in relation to pivot points:
| Pivot points | S3 | S2 | S1 | PP | R1 | R2 | R3 |
|---|---|---|---|---|---|---|---|
| Standard | 2,275.3 | 2,285.2 | 2,300.8 | 2,310.7 | 2,326.3 | 2,336.2 | 2,351.8 |
| Camarilla | 2,309.5 | 2,311.8 | 2,314.2 | 2,316.5 | 2,318.8 | 2,321.2 | 2,323.5 |
| Woodie | 2,278.3 | 2,286.6 | 2,303.8 | 2,312.1 | 2,329.3 | 2,337.6 | 2,354.8 |
| Fibonacci | 2,285.2 | 2,294.9 | 2,300.9 | 2,310.7 | 2,320.4 | 2,326.4 | 2,336.2 |
| Pivot points | S3 | S2 | S1 | PP | R1 | R2 | R3 |
|---|---|---|---|---|---|---|---|
| Standard | 2,081.0 | 2,128.0 | 2,214.5 | 2,261.5 | 2,348.0 | 2,395.0 | 2,481.5 |
| Camarilla | 2,264.3 | 2,276.5 | 2,288.8 | 2,301.0 | 2,313.2 | 2,325.5 | 2,337.7 |
| Woodie | 2,100.8 | 2,137.9 | 2,234.3 | 2,271.4 | 2,367.8 | 2,404.9 | 2,501.3 |
| Fibonacci | 2,128.0 | 2,179.0 | 2,210.5 | 2,261.5 | 2,312.5 | 2,344.0 | 2,395.0 |
| Pivot points | S3 | S2 | S1 | PP | R1 | R2 | R3 |
|---|---|---|---|---|---|---|---|
| Standard | 1,648.7 | 1,718.7 | 1,838.3 | 1,908.3 | 2,027.9 | 2,097.9 | 2,217.5 |
| Camarilla | 1,905.7 | 1,923.0 | 1,940.4 | 1,957.8 | 1,975.2 | 1,992.6 | 2,009.9 |
| Woodie | 1,673.4 | 1,731.1 | 1,863.0 | 1,920.7 | 2,052.6 | 2,110.3 | 2,242.2 |
| Fibonacci | 1,718.7 | 1,791.2 | 1,835.9 | 1,908.3 | 1,980.8 | 2,025.5 | 2,097.9 |
Numerical data
The following are the details of the technical indicators and moving averages that were collected to generate this technical analysis:
| RSI (14): | 72.10 | |
| MACD (12,26,9): | 10.6000 | |
| Directional Movement: | 22.0 | |
| AROON (14): | 92.9 | |
| DEMA (21): | 2,323.4 | |
| Parabolic SAR (0,02-0,02-0,2): | 2,298.1 | |
| Elder Ray (13): | 21.7 | |
| Super Trend (3,10): | 2,303.0 | |
| Zig ZAG (10): | 2,339.0 | |
| VORTEX (21): | 1.1000 | |
| Stochastique (14,3,5): | 92.60 | |
| TEMA (21): | 2,323.8 | |
| Williams %R (14): | -7.50 | |
| Chande Momentum Oscillator (20): | 35.5 | |
| Repulse (5,40,3): | 0.8000 | |
| ROCnROLL: | 1 | |
| TRIX (15,9): | 0.0000 | |
| Courbe Coppock: | 2.00 |
| MA7: | 2,292.4 | |
| MA20: | 2,184.0 | |
| MA50: | 2,005.9 | |
| MA100: | 1,931.8 | |
| MAexp7: | 2,322.6 | |
| MAexp20: | 2,310.1 | |
| MAexp50: | 2,287.3 | |
| MAexp100: | 2,243.0 | |
| Price / MA7: | +2.05% | |
| Price / MA20: | +7.12% | |
| Price / MA50: | +16.63% | |
| Price / MA100: | +21.10% | |
| Price / MAexp7: | +0.73% | |
| Price / MAexp20: | +1.27% | |
| Price / MAexp50: | +2.28% | |
| Price / MAexp100: | +4.30% |
News
Don't forget to follow the news on HERMES INTL. At the time of publication of this analysis, the latest news was as follows:
- Federated Hermes, Inc.'s CEO to participate in 2024 RBC Capital Markets Financial Institutions Conference
- Federated Hermes, Inc. files annual report on Form 10-K with U.S. Securities and Exchange Commission
- Federated Hermes, Inc. announces nomination of new independent director
- Hermès International: Release on compensation of Executive Chairmen as of 15 February 2024
- Month-end portfolio data now available for Federated Hermes Premier Municipal Income Fund
About author
Online


Add a comment
Comments
0 comments on the analysis HERMES INTL - 1H