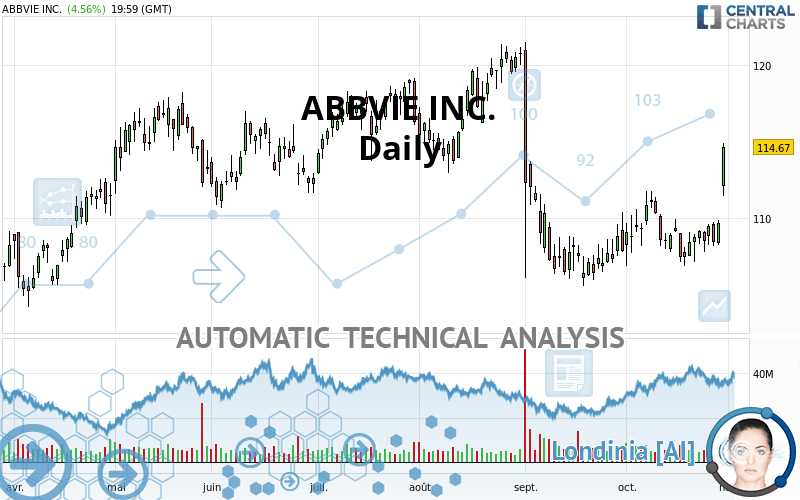
ABBVIE INC. - Daily - Technical analysis published on 11/01/2021 (GMT)
- 246
- 0
Click here for a new analysis!
- Timeframe : Daily
- - Analysis generated on
- Status : TARGET REACHED

Summary of the analysis

Additional analysis
Quotes
ABBVIE INC. rating 114.67 USD. The price registered an increase of +4.56% on the session and was between 111.42 USD and 114.92 USD. This implies that the price is at +2.92% from its lowest and at -0.22% from its highest.A bullish gap was detected at the opening by the Central Gaps scanner. There are a lot of buyers and they have the upper hand in the very short term.
Opening Gap UP
Type : Bullish
Timeframe : Openning
A study of price movements over other periods shows the following variations:
Near a new HIGH record (5 years)
Type : Bullish
Timeframe : Weekly
Near a new HIGH record (1 year)
Type : Bullish
Timeframe : Weekly
Near a new HIGH record (1st january)
Type : Bullish
Timeframe : Weekly
Technical
A technical analysis in Daily of this ABBVIE INC. chart shows a bullish trend. 64.29% of the signals given by moving averages are bullish. The overall trend is reinforced by the strong bullish signals from short-term moving averages. The Central Indicators market scanner is currently detecting a bullish signal that could impact this trend:
Bullish price crossover with Moving Average 50
Type : Bullish
Timeframe : Daily
Technical indicators are strongly bullish, suggesting that the price increase should continue.
Caution: the Central Indicators scanner currently detects an excess:
Williams %R indicator is overbought : over -20
Type : Neutral
Timeframe : Daily
Pivot points : price is over resistance 3
Type : Neutral
Timeframe : Daily
Pivot points : price is over resistance 3
Type : Neutral
Timeframe : Weekly
RSI indicator is back over 50
Type : Bullish
Timeframe : Daily
MACD indicator is back over 0
Type : Bullish
Timeframe : Daily
Momentum indicator is back over 0
Type : Bullish
Timeframe : Daily
Williams %R indicator is back over -50
Type : Bullish
Timeframe : Daily
An analysis of the price chart with the Central Patterns scanner (detector of chart patterns and resistances and supports) shows several results that can have an impact on the price change:
Near horizontal resistance
Type : Bearish
Timeframe : Daily
Resistance of channel is broken
Type : Bullish
Timeframe : Daily
The presence of a bullish Japanese candlestick pattern detected by Central Candlesticks that could cause a very short term rebound was also detected:
Bullish engulfing lines
Type : Bullish
Timeframe : Daily
| S3 | S2 | S1 | Price | R1 | R2 | R3 | |
|---|---|---|---|---|---|---|---|
| ProTrendLines | 108.63 | 110.85 | 112.62 | 114.67 | 117.21 | 120.78 | 123.21 |
| Change (%) | -5.27% | -3.33% | -1.79% | - | +2.22% | +5.33% | +7.45% |
| Change | -6.04 | -3.82 | -2.05 | - | +2.54 | +6.11 | +8.54 |
| Level | Intermediate | Intermediate | Major | - | Intermediate | Intermediate | Major |
To determine price objectives, it is also possible to use the pivot points. Here is the price position in relation to pivot points:
| Pivot points | S3 | S2 | S1 | PP | R1 | R2 | R3 |
|---|---|---|---|---|---|---|---|
| Standard | 108.92 | 110.17 | 112.42 | 113.67 | 115.92 | 117.17 | 119.42 |
| Camarilla | 113.71 | 114.03 | 114.35 | 114.67 | 114.99 | 115.31 | 115.63 |
| Woodie | 109.42 | 110.42 | 112.92 | 113.92 | 116.42 | 117.42 | 119.92 |
| Fibonacci | 110.17 | 111.51 | 112.33 | 113.67 | 115.01 | 115.83 | 117.17 |
| Pivot points | S3 | S2 | S1 | PP | R1 | R2 | R3 |
|---|---|---|---|---|---|---|---|
| Standard | 102.80 | 105.28 | 109.97 | 112.45 | 117.14 | 119.62 | 124.31 |
| Camarilla | 112.70 | 113.36 | 114.01 | 114.67 | 115.33 | 115.99 | 116.64 |
| Woodie | 103.92 | 105.83 | 111.09 | 113.00 | 118.26 | 120.17 | 125.43 |
| Fibonacci | 105.28 | 108.02 | 109.71 | 112.45 | 115.19 | 116.88 | 119.62 |
| Pivot points | S3 | S2 | S1 | PP | R1 | R2 | R3 |
|---|---|---|---|---|---|---|---|
| Standard | 84.79 | 94.55 | 100.56 | 110.32 | 116.33 | 126.09 | 132.10 |
| Camarilla | 102.24 | 103.69 | 105.13 | 106.58 | 108.03 | 109.47 | 110.92 |
| Woodie | 82.93 | 93.61 | 98.70 | 109.38 | 114.47 | 125.15 | 130.24 |
| Fibonacci | 94.55 | 100.57 | 104.29 | 110.32 | 116.34 | 120.06 | 126.09 |
Numerical data
The following is the status of the technical indicators and moving averages at the time of publication of this technical analysis:
| RSI (14): | 68.32 | |
| MACD (12,26,9): | 0.5600 | |
| Directional Movement: | 16.78 | |
| AROON (14): | 85.71 | |
| DEMA (21): | 109.53 | |
| Parabolic SAR (0,02-0,02-0,2): | 106.00 | |
| Elder Ray (13): | 3.66 | |
| Super Trend (3,10): | 107.23 | |
| Zig ZAG (10): | 114.67 | |
| VORTEX (21): | 1.0400 | |
| Stochastique (14,3,5): | 76.96 | |
| TEMA (21): | 110.75 | |
| Williams %R (14): | -3.04 | |
| Chande Momentum Oscillator (20): | 7.44 | |
| Repulse (5,40,3): | 4.1100 | |
| ROCnROLL: | 1 | |
| TRIX (15,9): | 0.0000 | |
| Courbe Coppock: | 2.73 |
| MA7: | 109.80 | |
| MA20: | 108.84 | |
| MA50: | 109.57 | |
| MA100: | 111.76 | |
| MAexp7: | 110.35 | |
| MAexp20: | 109.12 | |
| MAexp50: | 109.57 | |
| MAexp100: | 109.88 | |
| Price / MA7: | +4.44% | |
| Price / MA20: | +5.36% | |
| Price / MA50: | +4.65% | |
| Price / MA100: | +2.60% | |
| Price / MAexp7: | +3.91% | |
| Price / MAexp20: | +5.09% | |
| Price / MAexp50: | +4.65% | |
| Price / MAexp100: | +4.36% |
News
The latest news and videos published on ABBVIE INC. at the time of the analysis were as follows:
- U.S. Food and Drug Administration Approves VUITY™ (pilocarpine HCI ophthalmic solution) 1.25%, the First and Only Eye Drop to Treat Presbyopia (Age-Related Blurry Near Vision)
- Thinking about trading options or stock in AbbVie, Colgate-Palmolive, Alibaba, Advanced Micro Devices, or Anthem?
- AbbVie's Cariprazine (VRAYLAR®) Met Primary Endpoint in Phase 3 Study as an Adjunctive Treatment for Major Depressive Disorder
- AbbVie Reports Third-Quarter 2021 Financial Results
- AbbVie Announces ABBV-951 (Foslevodopa/Foscarbidopa) Showed Improvement in Controlling Motor Fluctuations Compared to Oral Levodopa/Carbidopa Medication in Pivotal Phase 3 Trial in Patients with Advanced Parkinson's Disease
About author

Online


Add a comment
Comments
0 comments on the analysis ABBVIE INC. - Daily