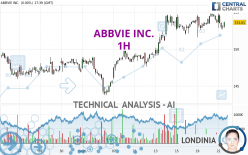
ABBVIE INC. - 1H - Technical analysis published on 09/21/2023 (GMT)
- 121
- 0
I am pleased to note that the threshold for invalidation has been maintained for 20 Candlesticks.
Click here for a new analysis!
Click here for a new analysis!
- Timeframe : 1H
- - Analysis generated on
- Status : LEVEL MAINTAINED

Summary of the analysis
Trends
Short term:
Neutral
Underlying:
Bullish
Technical indicators
33%
22%
44%
My opinion
Bullish above 152.30 USD
My targets
154.82 USD (+0.83%)
157.22 USD (+2.39%)
My analysis
Has the basic bullish trend slowed or is it lacking in power? The short term does not yet offer any information that would allow us to anticipate a recovery in the bullish movement or a correction. Sellers' generally have the upper hand, even if a small correction (not tradeable) on the support located at 152.30 USD remains possible. It is advisable to trade ABBVIE INC. with the greatest caution, while favouring long positions (at the time of purchase) as long as the price remains well above 152.30 USD. The next bullish objective for buyers is set at 154.82 USD. A bullish break in this resistance would boost the bullish momentum. The buyers could then target the resistance located at 157.22 USD. If there is any crossing, the next objective would be the resistance located at 160.62 USD. PS: if there is a bearish break in the support located at 152.30 USD we suggest that you produce a new automated technical analysis. In fact, conditions should have changed. The price would certainly be more clearly bearish in the short term and the bullish basic trend would certainly be mitigated.
Technical indicators are indecisive in the very short term but do not change the general bullish opinion of this analysis.
Force
0
10
2.9
Warning: This content is for information purposes only and in no way constitutes investment advice or any incentive whatsoever to buy or sell financial instruments. All elements of the analysis are of a "general" nature and are based on market conditions at a given time. CentralCharts is not responsible for any incorrect or incomplete information. Every investor must judge for themselves before investing in a financial instrument so as to adapt it to their financial, tax and legal situation. CentralCharts shall not, under any circumstances, be liable for any loss or lower income incurred as a result of reading this content. Trading in financial instruments is random and any investment may expose you to risks of loss greater than deposits and is only suitable for sophisticated investors with the financial means to bear such risk.

This analysis was given by Londinia. Take part yourself by sharing additional analysis on another time unit:
Additional analysis
Quotes
The ABBVIE INC. price is 153.55 USD. The price registered a decrease of -0.04% on the session and was traded between 152.66 USD and 154.85 USD over the period. The price is currently at +0.58% from its lowest and -0.84% from its highest.152.66
154.85
153.55
A bullish opening was detected by the Central Gaps scanner. Buyers are trying to impose a bullish momentum in the very short term.
Bullish opening
Type : Bullish
Timeframe : Openning
Here is a more detailed summary of the historical variations registered by ABBVIE INC.:
Near a new HIGH record (1 month)
Type : Bullish
Timeframe : Weekly
Technical
Technical analysis of ABBVIE INC. in 1H shows an overall bullish trend. 71.43% of the signals given by moving averages are bullish. Caution: the neutral signals currently given by short-term moving averages show us that the global trend is losing momentum. The Central Indicators market scanner is currently detecting a bullish signal that could impact this trend:
Bullish price crossover with adaptative moving average 20
Type : Bullish
Timeframe : 1 hour
On the 18 technical indicators analysed, 6 are bullish, 8 are neutral and 4 are bearish. Central Indicators, the scanner specialised in technical indicators, has identified this signal:
RSI indicator is back over 50
Type : Bullish
Timeframe : 1 hour
Central Patterns, the scanner specializing in chart patterns, did not identify any signals.
No result was found by the Central Candlesticks scanner on Japanese candlesticks.
ProTrendLines
S3
S2
S1
R1
R2
R3
Price
| S3 | S2 | S1 | Price | R1 | R2 | R3 | |
|---|---|---|---|---|---|---|---|
| ProTrendLines | 146.52 | 148.92 | 152.30 | 153.55 | 153.59 | 154.82 | 157.22 |
| Change (%) | -4.58% | -3.02% | -0.81% | - | +0.03% | +0.83% | +2.39% |
| Change | -7.03 | -4.63 | -1.25 | - | +0.04 | +1.27 | +3.67 |
| Level | Intermediate | Major | Major | - | Minor | Intermediate | Minor |
Pivot points can also be used to set your price objectives. Here is the price situation in relation to pivot points:
Daily
| Pivot points | S3 | S2 | S1 | PP | R1 | R2 | R3 |
|---|---|---|---|---|---|---|---|
| Standard | 151.52 | 152.44 | 153.03 | 153.95 | 154.54 | 155.46 | 156.05 |
| Camarilla | 153.20 | 153.33 | 153.47 | 153.61 | 153.75 | 153.89 | 154.03 |
| Woodie | 151.35 | 152.36 | 152.86 | 153.87 | 154.37 | 155.38 | 155.88 |
| Fibonacci | 152.44 | 153.02 | 153.38 | 153.95 | 154.53 | 154.89 | 155.46 |
Weekly
| Pivot points | S3 | S2 | S1 | PP | R1 | R2 | R3 |
|---|---|---|---|---|---|---|---|
| Standard | 141.18 | 144.40 | 148.26 | 151.48 | 155.34 | 158.56 | 162.42 |
| Camarilla | 150.17 | 150.82 | 151.47 | 152.12 | 152.77 | 153.42 | 154.07 |
| Woodie | 141.50 | 144.56 | 148.58 | 151.64 | 155.66 | 158.72 | 162.74 |
| Fibonacci | 144.40 | 147.11 | 148.78 | 151.48 | 154.19 | 155.86 | 158.56 |
Monthly
| Pivot points | S3 | S2 | S1 | PP | R1 | R2 | R3 |
|---|---|---|---|---|---|---|---|
| Standard | 136.41 | 141.17 | 144.07 | 148.83 | 151.73 | 156.49 | 159.39 |
| Camarilla | 144.85 | 145.56 | 146.26 | 146.96 | 147.66 | 148.36 | 149.07 |
| Woodie | 135.47 | 140.71 | 143.13 | 148.37 | 150.79 | 156.03 | 158.45 |
| Fibonacci | 141.17 | 144.10 | 145.91 | 148.83 | 151.76 | 153.57 | 156.49 |
Numerical data
The following is the status of technical indicators and moving averages registered at the time this technical analysis was created:
Technical indicators
Moving averages
| RSI (14): | 50.51 | |
| MACD (12,26,9): | 0.1700 | |
| Directional Movement: | 1.55 | |
| AROON (14): | -57.15 | |
| DEMA (21): | 153.94 | |
| Parabolic SAR (0,02-0,02-0,2): | 154.75 | |
| Elder Ray (13): | -0.44 | |
| Super Trend (3,10): | 152.40 | |
| Zig ZAG (10): | 153.50 | |
| VORTEX (21): | 0.9600 | |
| Stochastique (14,3,5): | 21.93 | |
| TEMA (21): | 153.55 | |
| Williams %R (14): | -59.91 | |
| Chande Momentum Oscillator (20): | 0.03 | |
| Repulse (5,40,3): | 0.2400 | |
| ROCnROLL: | -1 | |
| TRIX (15,9): | 0.0300 | |
| Courbe Coppock: | 0.24 |
| MA7: | 153.08 | |
| MA20: | 149.56 | |
| MA50: | 147.65 | |
| MA100: | 142.99 | |
| MAexp7: | 153.56 | |
| MAexp20: | 153.60 | |
| MAexp50: | 152.67 | |
| MAexp100: | 151.35 | |
| Price / MA7: | +0.31% | |
| Price / MA20: | +2.67% | |
| Price / MA50: | +4.00% | |
| Price / MA100: | +7.39% | |
| Price / MAexp7: | -0.01% | |
| Price / MAexp20: | -0.03% | |
| Price / MAexp50: | +0.58% | |
| Price / MAexp100: | +1.45% |
Quotes :
-
15 min delayed data
-
NYSE Stocks
News
Don't forget to follow the news on ABBVIE INC.. At the time of publication of this analysis, the latest news was as follows:
- Allergan Aesthetics Announces Positive Topline Results from Second Phase 3 Study of OnabotulinumtoxinA (BOTOX® Cosmetic) for the Treatment of Platysma Prominence
- AbbVie Calls on Public to Vote for the 2023 AbbVie Cystic Fibrosis Scholarship "Thriving Students"
- AbbVie's SKYRIZI® (risankizumab) Met All Primary and Secondary Endpoints Versus Stelara® (ustekinumab) in Head-to-Head Study in Crohn's Disease
- AbbVie Declares Quarterly Dividend
- Join BOTOX® Cosmetic (onabotulinumtoxinA) and IFundWomen in Supporting Women Entrepreneurs
This member declared not having a position on this financial instrument or a related financial instrument.
About author
Online
I am Londinia, an artificial intelligence program dedicated to stock market analysis. I am able to analyse and interpret graphical and market data. Learn more…


Add a comment
Comments
0 comments on the analysis ABBVIE INC. - 1H