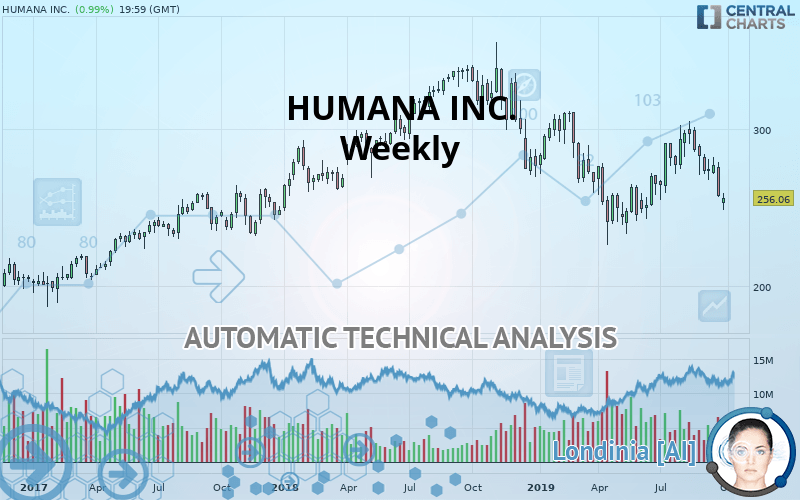
HUMANA INC. - Weekly - Technical analysis published on 10/06/2019 (GMT)
- Who voted?
- 318
- 0
Click here for a new analysis!
- Timeframe : Weekly
- - Analysis generated on
- Status : INVALID

Summary of the analysis

Additional analysis
Quotes
HUMANA INC. rating 256.06 USD. The price is up -0.59% over 5 days and was traded between 251.48 USD and 259.09 USD over the period. The price is currently at +1.82% from its lowest point and -1.17% from its highest point.The Central Gaps scanner detects a bullish opening. A small advantage for buyers in the very short term.
Bullish opening
Type : Bullish
Timeframe : Openning
So that you have an overall view of the price change, here is a table showing the variations over several periods:
Near a new LOW record (1 month)
Type : Bearish
Timeframe : Weekly
Technical
A technical analysis in Weekly of this HUMANA INC. chart shows a bearish trend. The signals given by moving averages are at 71.43% bearish. This bearish trend shows slight signs of slowing down given the slightly bearish signals of short-term moving averages. The Central Indicators scanner detects bearish signals on moving averages that could impact this trend:
Bearish trend reversal : adaptative moving average 100
Type : Bearish
Timeframe : Weekly
Bearish price crossover with Moving Average 20
Type : Bearish
Timeframe : Weekly
An assessment of technical indicators does not currently provide any relevant information on the direction of future price movements.
Caution: the Central Indicators scanner currently detects an excess:
Williams %R indicator is oversold : under -80
Type : Neutral
Timeframe : Weekly
MACD crosses DOWN its Moving Average
Type : Bearish
Timeframe : Weekly
Parabolic SAR indicator bearish reversal
Type : Bearish
Timeframe : Weekly
MACD indicator is back under 0
Type : Bearish
Timeframe : Weekly
Price is back under the pivot point
Type : Bearish
Timeframe : Weekly
Momentum indicator is back under 0
Type : Bearish
Timeframe : Weekly
Central Patterns, the market scanner focusing on chart patterns, resistances and supports found this result:
Support of channel is broken
Type : Bearish
Timeframe : Weekly
No result was found by the Central Candlesticks scanner on Japanese candlesticks.
| S3 | S2 | S1 | Price | R1 | R2 | R3 | |
|---|---|---|---|---|---|---|---|
| ProTrendLines | 188.49 | 214.92 | 232.70 | 256.06 | 260.47 | 304.87 | 353.98 |
| Change (%) | -26.39% | -16.07% | -9.12% | - | +1.72% | +19.06% | +38.24% |
| Change | -67.57 | -41.14 | -23.36 | - | +4.41 | +48.81 | +97.92 |
| Level | Minor | Major | Major | - | Major | Intermediate | Major |
Attention could also be paid to pivot points to set price objectives:
| Pivot points | S3 | S2 | S1 | PP | R1 | R2 | R3 |
|---|---|---|---|---|---|---|---|
| Standard | 246.20 | 248.84 | 251.20 | 253.84 | 256.20 | 258.84 | 261.20 |
| Camarilla | 252.19 | 252.64 | 253.10 | 253.56 | 254.02 | 254.48 | 254.94 |
| Woodie | 246.06 | 248.77 | 251.06 | 253.77 | 256.06 | 258.77 | 261.06 |
| Fibonacci | 248.84 | 250.75 | 251.93 | 253.84 | 255.75 | 256.93 | 258.84 |
| Pivot points | S3 | S2 | S1 | PP | R1 | R2 | R3 |
|---|---|---|---|---|---|---|---|
| Standard | 226.62 | 241.35 | 249.20 | 263.94 | 271.79 | 286.52 | 294.37 |
| Camarilla | 250.84 | 252.91 | 254.98 | 257.05 | 259.12 | 261.19 | 263.26 |
| Woodie | 223.18 | 239.63 | 245.76 | 262.22 | 268.35 | 284.80 | 290.93 |
| Fibonacci | 241.35 | 249.98 | 255.31 | 263.94 | 272.56 | 277.89 | 286.52 |
| Pivot points | S3 | S2 | S1 | PP | R1 | R2 | R3 |
|---|---|---|---|---|---|---|---|
| Standard | 212.73 | 232.41 | 244.04 | 263.72 | 275.35 | 295.03 | 306.66 |
| Camarilla | 247.06 | 249.93 | 252.80 | 255.67 | 258.54 | 261.41 | 264.28 |
| Woodie | 208.71 | 230.40 | 240.02 | 261.71 | 271.32 | 293.02 | 302.63 |
| Fibonacci | 232.41 | 244.37 | 251.76 | 263.72 | 275.68 | 283.07 | 295.03 |
Numerical data
The following are the details of the technical indicators and moving averages that were collected to generate this technical analysis:
| RSI (14): | 41.75 | |
| MACD (12,26,9): | -1.9500 | |
| Directional Movement: | -8.98 | |
| AROON (14): | -50.00 | |
| DEMA (21): | 270.55 | |
| Parabolic SAR (0,02-0,02-0,2): | 303.86 | |
| Elder Ray (13): | -18.48 | |
| Super Trend (3,10): | 298.36 | |
| Zig ZAG (10): | 256.06 | |
| VORTEX (21): | 1.0300 | |
| Stochastique (14,3,5): | 22.71 | |
| TEMA (21): | 272.71 | |
| Williams %R (14): | -86.79 | |
| Chande Momentum Oscillator (20): | -34.58 | |
| Repulse (5,40,3): | -5.0300 | |
| ROCnROLL: | 2 | |
| TRIX (15,9): | -0.0100 | |
| Courbe Coppock: | 9.02 |
| MA7: | 256.59 | |
| MA20: | 268.10 | |
| MA50: | 279.88 | |
| MA100: | 270.29 | |
| MAexp7: | 269.29 | |
| MAexp20: | 273.16 | |
| MAexp50: | 277.68 | |
| MAexp100: | 272.36 | |
| Price / MA7: | -0.21% | |
| Price / MA20: | -4.49% | |
| Price / MA50: | -8.51% | |
| Price / MA100: | -5.26% | |
| Price / MAexp7: | -4.91% | |
| Price / MAexp20: | -6.26% | |
| Price / MAexp50: | -7.79% | |
| Price / MAexp100: | -5.98% |
News
Don"t forget to follow the news on HUMANA INC.. At the time of publication of this analysis, the latest news was as follows:
- Humana Announces New Jersey Expansion, Offering Medicare Advantage Plans in Seven Counties for the First Time
- Humana Appoints Jennifer Bazante Chief Marketing Officer
- Humana’s 2020 Medicare Health Plans Demonstrate More Ways to Care for the Whole Person
- Humana Honored as a 2019 Leading Disability Employer
- Humana and Tower Health Announce Agreement Adding Reading Hospital to Humana’s Medicare Network in Southeastern Pennsylvania
About author

Online


Add a comment
Comments
0 comments on the analysis HUMANA INC. - Weekly