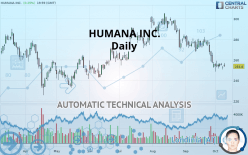
HUMANA INC. - Daily - Technical analysis published on 10/10/2019 (GMT)
- Who voted?
- 346
- 0
Oops, I was wrong about that analysis. My threshold for invalidation has been broken.
Click here for a new analysis!
Click here for a new analysis!
- Timeframe : Daily
- - Analysis generated on
- Status : INVALID
Summary of the analysis
Trends
Court terme:
Strongly bearish
De fond:
Bearish
Technical indicators
28%
50%
22%
My opinion
Bearish under 260.47 USD
My targets
252.83 USD (-0.38%)
243.21 USD (-4.17%)
My analysis
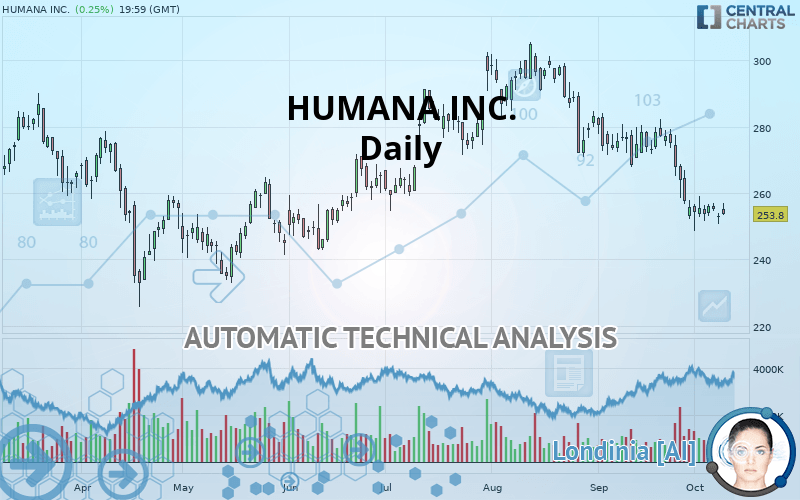
HUMANA INC. is part of a very strong bearish trend. Traders may consider trading only short positions (for sale) as long as the price remains well below 260.47 USD. The next support located at 252.83 USD is the next bearish objective to target. A bearish break of this support would revive the bearish momentum. The bearish movement could then continue towards the next support located at 243.21 USD. Below this support, sellers could then target 232.70 USD.
Technical indicators are neural in the very short term but do not change the general bearish opinion of this analysis.
FORCE
0
10
5.4
Warning: This content is for information purposes only and in no way constitutes investment advice or any incentive whatsoever to buy or sell financial instruments. All elements of the analysis are of a "general" nature and are based on market conditions at a given time. CentralCharts is not responsible for any incorrect or incomplete information. Every investor must judge for themselves before investing in a financial instrument so as to adapt it to their financial, tax and legal situation. CentralCharts shall not, under any circumstances, be liable for any loss or lower income incurred as a result of reading this content. Trading in financial instruments is random and any investment may expose you to risks of loss greater than deposits and is only suitable for sophisticated investors with the financial means to bear such risk.

This analysis was given by emerick. Take part yourself by sharing additional analysis on another time unit:
Additional analysis
Quotes
The HUMANA INC. rating is 253.80 USD. The price has increased by +0.25% since the last closing with the lowest point at 253.44 USD and the highest point at 257.06 USD. The deviation from the price is +0.14% for the low point and -1.27% for the high point.253.44
257.06
253.80
The Central Gaps scanner detects a bullish gap which is a sign that buyers have taken the lead in the very short term.
Opening Gap UP
Type : Bullish
Timeframe : Openning
Here is a more detailed summary of the historical variations registered by HUMANA INC.:
Near a new LOW record (1 month)
Type : Bearish
Timeframe : Weekly
Technical
Technical analysis of HUMANA INC. in Daily shows an overall bearish trend. 78.57% of the signals given by moving averages are bearish. This bearish trend is supported by the strong bearish signals given by short-term moving averages. The Central Indicators scanner does not detect any result on moving averages that would impact this trend.
On the 18 technical indicators analysed, 5 are bullish, 4 are neutral and 9 are bearish. Caution: the Central Indicators scanner currently detects an excess:
CCI indicator is oversold : under -100
Type : Neutral
Timeframe : Daily
Williams %R indicator is oversold : under -80
Type : Neutral
Timeframe : Daily
Price is back over the pivot point
Type : Bullish
Timeframe : Weekly
An analysis of the price chart with the Central Patterns scanner (detector of chart patterns and resistances and supports) shows several results that can have an impact on the price change:
Near horizontal support
Type : Bullish
Timeframe : Daily
Near support of channel
Type : Bullish
Timeframe : Daily
Near support of triangle
Type : Bullish
Timeframe : Daily
The Central Candlesticks scanner which studies Japanese candlesticks did not detect anything.
ProTrendLines
S3
S2
S1
R1
R2
R3
Price
| S3 | S2 | S1 | Price | R1 | R2 | R3 | |
|---|---|---|---|---|---|---|---|
| ProTrendLines | 232.70 | 243.21 | 252.83 | 253.80 | 260.47 | 273.17 | 286.63 |
| Change (%) | -8.31% | -4.17% | -0.38% | - | +2.63% | +7.63% | +12.94% |
| Change | -21.10 | -10.59 | -0.97 | - | +6.67 | +19.37 | +32.83 |
| Level | Major | Minor | Intermediate | - | Intermediate | Major | Minor |
Pivot points can also be used to set your price objectives. Here is the price situation in relation to pivot points:
Daily
| Pivot points | S3 | S2 | S1 | PP | R1 | R2 | R3 |
|---|---|---|---|---|---|---|---|
| Standard | 247.75 | 249.14 | 251.15 | 252.54 | 254.55 | 255.94 | 257.95 |
| Camarilla | 252.24 | 252.55 | 252.86 | 253.17 | 253.48 | 253.79 | 254.11 |
| Woodie | 248.07 | 249.30 | 251.47 | 252.70 | 254.87 | 256.10 | 258.27 |
| Fibonacci | 249.14 | 250.44 | 251.24 | 252.54 | 253.84 | 254.64 | 255.94 |
Weekly
| Pivot points | S3 | S2 | S1 | PP | R1 | R2 | R3 |
|---|---|---|---|---|---|---|---|
| Standard | 239.65 | 244.14 | 250.10 | 254.60 | 260.56 | 265.05 | 271.01 |
| Camarilla | 253.19 | 254.14 | 255.10 | 256.06 | 257.02 | 257.98 | 258.94 |
| Woodie | 240.38 | 244.51 | 250.83 | 254.96 | 261.29 | 265.42 | 271.74 |
| Fibonacci | 244.14 | 248.13 | 250.60 | 254.60 | 258.59 | 261.06 | 265.05 |
Monthly
| Pivot points | S3 | S2 | S1 | PP | R1 | R2 | R3 |
|---|---|---|---|---|---|---|---|
| Standard | 212.73 | 232.41 | 244.04 | 263.72 | 275.35 | 295.03 | 306.66 |
| Camarilla | 247.06 | 249.93 | 252.80 | 255.67 | 258.54 | 261.41 | 264.28 |
| Woodie | 208.71 | 230.40 | 240.02 | 261.71 | 271.32 | 293.02 | 302.63 |
| Fibonacci | 232.41 | 244.37 | 251.76 | 263.72 | 275.68 | 283.07 | 295.03 |
Numerical data
The following is the status of the technical indicators and moving averages at the time of publication of this technical analysis:
Technical indicators
Moving averages
| RSI (14): | 33.40 | |
| MACD (12,26,9): | -6.8800 | |
| Directional Movement: | -17.12 | |
| AROON (14): | -50.00 | |
| DEMA (21): | 254.34 | |
| Parabolic SAR (0,02-0,02-0,2): | 257.09 | |
| Elder Ray (13): | -4.03 | |
| Super Trend (3,10): | 271.28 | |
| Zig ZAG (10): | 253.80 | |
| VORTEX (21): | 0.8300 | |
| Stochastique (14,3,5): | 16.39 | |
| TEMA (21): | 250.65 | |
| Williams %R (14): | -84.43 | |
| Chande Momentum Oscillator (20): | -22.92 | |
| Repulse (5,40,3): | -0.8400 | |
| ROCnROLL: | 2 | |
| TRIX (15,9): | -0.3300 | |
| Courbe Coppock: | 14.63 |
| MA7: | 254.53 | |
| MA20: | 264.83 | |
| MA50: | 278.31 | |
| MA100: | 270.60 | |
| MAexp7: | 255.67 | |
| MAexp20: | 263.03 | |
| MAexp50: | 270.36 | |
| MAexp100: | 272.18 | |
| Price / MA7: | -0.29% | |
| Price / MA20: | -4.16% | |
| Price / MA50: | -8.81% | |
| Price / MA100: | -6.21% | |
| Price / MAexp7: | -0.73% | |
| Price / MAexp20: | -3.51% | |
| Price / MAexp50: | -6.13% | |
| Price / MAexp100: | -6.75% |
News
Don"t forget to follow the news on HUMANA INC.. At the time of publication of this analysis, the latest news was as follows:
- ‘Humana Honor’ Plans Affirm Humana’s Commitment To Veterans, Complement Veterans Affairs (VA) Health Care
- Journal of the American Medical Association (JAMA) Publishes Humana Study on Health Care Spending
- Humana Announces New Jersey Expansion, Offering Medicare Advantage Plans in Seven Counties for the First Time
- Humana Appoints Jennifer Bazante Chief Marketing Officer
- Humana’s 2020 Medicare Health Plans Demonstrate More Ways to Care for the Whole Person
This member declared not having a position on this financial instrument or a related financial instrument.
About author

Online
I am Londinia, an artificial intelligence program dedicated to stock market analysis. I am able to analyse and interpret graphical and market data. Learn more…


Add a comment
Comments
0 comments on the analysis HUMANA INC. - Daily