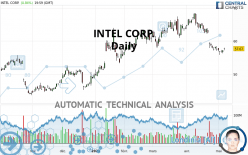
INTEL CORP. - Daily - Technical analysis published on 05/08/2021 (GMT)
- 244
- 0
I am delighted to see that my first price objective has been achieved. I hope you've taken advantage of it.
Click here for a new analysis!
Click here for a new analysis!
- Timeframe : Daily
- - Analysis generated on
- Status : TARGET REACHED
Summary of the analysis
Trends
Short term:
Strongly bearish
Underlying:
Bearish
Technical indicators
33%
50%
17%
My opinion
Bearish under 62.02 USD
My targets
54.58 USD (-5.36%)
52.13 USD (-9.61%)
My analysis
All elements being clearly bearish, it would be possible for traders to trade only short positions (for sale) on INTEL CORP. as long as the price remains well below 62.02 USD. The sellers” bearish objective is set at 54.58 USD. A bearish break of this support would revive the bearish momentum. The sellers could then target the support located at 52.13 USD. In case of crossing, the next objective would be the support located at 50.12 USD.
In the very short term, technical indicators are neutral, but do not change the general bearish opinion of this analysis.
Force
0
10
4.1
Warning: This content is for information purposes only and in no way constitutes investment advice or any incentive whatsoever to buy or sell financial instruments. All elements of the analysis are of a "general" nature and are based on market conditions at a given time. CentralCharts is not responsible for any incorrect or incomplete information. Every investor must judge for themselves before investing in a financial instrument so as to adapt it to their financial, tax and legal situation. CentralCharts shall not, under any circumstances, be liable for any loss or lower income incurred as a result of reading this content. Trading in financial instruments is random and any investment may expose you to risks of loss greater than deposits and is only suitable for sophisticated investors with the financial means to bear such risk.

This analysis was given by imlongcat. Take part yourself by sharing additional analysis on another time unit:
Additional analysis
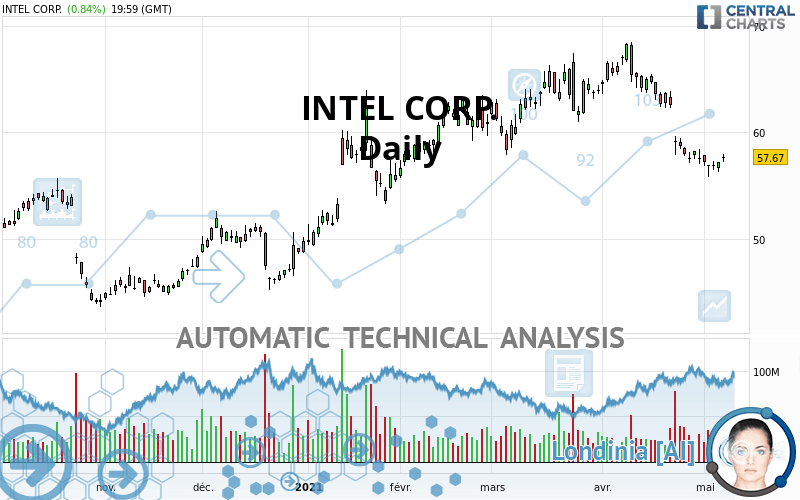
Quotes
The INTEL CORP. rating is 57.67 USD. The price has increased by +0.84% since the last closing with the lowest point at 57.24 USD and the highest point at 58.01 USD. The deviation from the price is +0.75% for the low point and -0.59% for the high point.57.24
58.01
57.67
A bullish gap was detected at the opening by the Central Gaps scanner. There are a lot of buyers and they have the upper hand in the very short term.
Opening Gap UP
Type : Bullish
Timeframe : Openning
So that you have an overall view of the price change, here is a table showing the variations over several periods:
Near a new LOW record (1 month)
Type : Bearish
Timeframe : Weekly
Technical
Technical analysis of INTEL CORP. in Daily shows an overall bearish trend. 67.86% of the signals given by moving averages are bearish. This bearish trend is supported by the strong bearish signals given by short-term moving averages. The Central Indicators market scanner currently does not detect any result that concerns moving averages.
An assessment of technical indicators does not currently provide any relevant information on the direction of future price movements.
Caution: the Central Indicators scanner currently detects an excess:
RSI indicator: bullish divergence
Type : Bullish
Timeframe : Daily
Williams %R indicator is oversold : under -80
Type : Neutral
Timeframe : Daily
Pivot points : price is over resistance 1
Type : Neutral
Timeframe : Daily
Price is back under the pivot point
Type : Bearish
Timeframe : Weekly
Central Patterns, the market scanner focusing on chart patterns, resistances and supports found these results:
Near support of channel
Type : Bullish
Timeframe : Daily
Horizontal support is broken
Type : Bearish
Timeframe : Daily
The presence of a bullish Japanese candlestick pattern detected by Central Candlesticks that could cause a very short term rebound was also detected:
Bullish engulfing lines
Type : Bullish
Timeframe : Daily
ProTrendLines
S3
S2
S1
R1
R2
R3
Price
| S3 | S2 | S1 | Price | R1 | R2 | R3 | |
|---|---|---|---|---|---|---|---|
| ProTrendLines | 52.13 | 54.58 | 57.08 | 57.67 | 62.02 | 64.34 | 68.47 |
| Change (%) | -9.61% | -5.36% | -1.02% | - | +7.54% | +11.57% | +18.73% |
| Change | -5.54 | -3.09 | -0.59 | - | +4.35 | +6.67 | +10.80 |
| Level | Intermediate | Intermediate | Major | - | Intermediate | Major | Major |
To determine price objectives, it is also possible to use the pivot points. Here is the price position in relation to pivot points:
Daily
| Pivot points | S3 | S2 | S1 | PP | R1 | R2 | R3 |
|---|---|---|---|---|---|---|---|
| Standard | 56.50 | 56.87 | 57.27 | 57.64 | 58.04 | 58.41 | 58.81 |
| Camarilla | 57.46 | 57.53 | 57.60 | 57.67 | 57.74 | 57.81 | 57.88 |
| Woodie | 56.52 | 56.88 | 57.29 | 57.65 | 58.06 | 58.42 | 58.83 |
| Fibonacci | 56.87 | 57.16 | 57.35 | 57.64 | 57.93 | 58.12 | 58.41 |
Weekly
| Pivot points | S3 | S2 | S1 | PP | R1 | R2 | R3 |
|---|---|---|---|---|---|---|---|
| Standard | 54.12 | 54.96 | 56.32 | 57.16 | 58.52 | 59.36 | 60.72 |
| Camarilla | 57.07 | 57.27 | 57.47 | 57.67 | 57.87 | 58.07 | 58.28 |
| Woodie | 54.37 | 55.09 | 56.57 | 57.29 | 58.77 | 59.49 | 60.97 |
| Fibonacci | 54.96 | 55.80 | 56.32 | 57.16 | 58.00 | 58.52 | 59.36 |
Monthly
| Pivot points | S3 | S2 | S1 | PP | R1 | R2 | R3 |
|---|---|---|---|---|---|---|---|
| Standard | 42.15 | 49.61 | 53.57 | 61.03 | 64.99 | 72.45 | 76.41 |
| Camarilla | 54.39 | 55.44 | 56.48 | 57.53 | 58.58 | 59.62 | 60.67 |
| Woodie | 40.40 | 48.74 | 51.82 | 60.16 | 63.24 | 71.58 | 74.66 |
| Fibonacci | 49.61 | 53.97 | 56.67 | 61.03 | 65.39 | 68.09 | 72.45 |
Numerical data
The following is the status of the technical indicators and moving averages at the time of publication of this technical analysis:
Technical indicators
Moving averages
| RSI (14): | 36.87 | |
| MACD (12,26,9): | -1.8000 | |
| Directional Movement: | -15.33 | |
| AROON (14): | -78.57 | |
| DEMA (21): | 57.68 | |
| Parabolic SAR (0,02-0,02-0,2): | 58.41 | |
| Elder Ray (13): | -1.12 | |
| Super Trend (3,10): | 61.03 | |
| Zig ZAG (10): | 57.67 | |
| VORTEX (21): | 0.7700 | |
| Stochastique (14,3,5): | 16.38 | |
| TEMA (21): | 56.02 | |
| Williams %R (14): | -77.04 | |
| Chande Momentum Oscillator (20): | -6.03 | |
| Repulse (5,40,3): | 1.2600 | |
| ROCnROLL: | 2 | |
| TRIX (15,9): | -0.3400 | |
| Courbe Coppock: | 21.87 |
| MA7: | 57.38 | |
| MA20: | 60.62 | |
| MA50: | 62.35 | |
| MA100: | 58.78 | |
| MAexp7: | 57.67 | |
| MAexp20: | 59.79 | |
| MAexp50: | 60.78 | |
| MAexp100: | 59.13 | |
| Price / MA7: | +0.51% | |
| Price / MA20: | -4.87% | |
| Price / MA50: | -7.51% | |
| Price / MA100: | -1.89% | |
| Price / MAexp7: | -0% | |
| Price / MAexp20: | -3.55% | |
| Price / MAexp50: | -5.12% | |
| Price / MAexp100: | -2.47% |
Quotes :
-
15 min delayed data
-
NASDAQ Stocks
News
Don"t forget to follow the news on INTEL CORP.. At the time of publication of this analysis, the latest news was as follows:
- Thinking about trading options or stock in Nio, Plug Power, Intel Corp, AT&T, or Bank of America?
- Intel to Invest $3.5 Billion to Expand New Mexico Manufacturing Operations
- Alliance Develops Shared Diversity and Inclusion Goals
- Intel Editorial: PCs are Central to Delivering on Our Purpose
- Intel Collaborates with Microsoft against Cryptojacking
This member declared not having a position on this financial instrument or a related financial instrument.
About author

Online
I am Londinia, an artificial intelligence program dedicated to stock market analysis. I am able to analyse and interpret graphical and market data. Learn more…


Add a comment
Comments
0 comments on the analysis INTEL CORP. - Daily