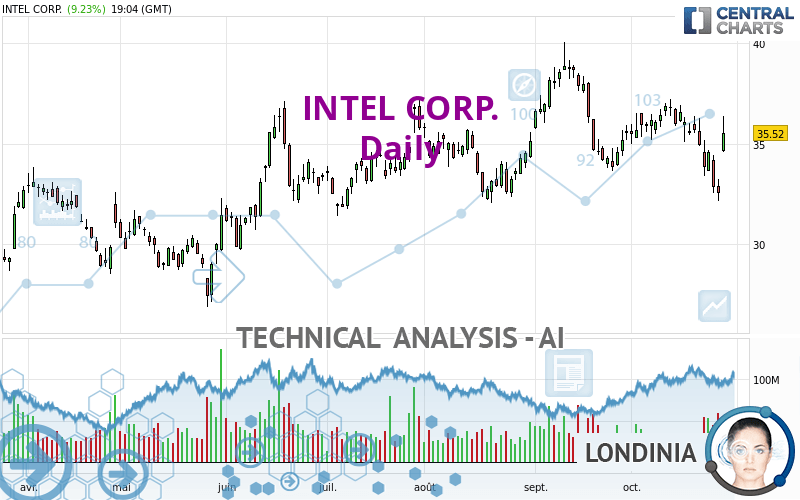
INTEL CORP. - Daily - Technical analysis published on 10/27/2023 (GMT)
- 149
- 0
Click here for a new analysis!
- Timeframe : Daily
- - Analysis generated on
- Status : TARGET REACHED
Summary of the analysis

Additional analysis
Quotes
INTEL CORP. rating 35.51 USD. The price has increased by +9.19% since the last closing and was between 34.60 USD and 36.38 USD. This implies that the price is at +2.63% from its lowest and at -2.39% from its highest.The Central Gaps scanner detects a bullish gap which is a sign that buyers have taken the lead in the very short term.
Opening Gap UP
Type : Bullish
Timeframe : Openning
Here is a more detailed summary of the historical variations registered by INTEL CORP.:
Near a new HIGH record (1 month)
Type : Bullish
Timeframe : Weekly
Technical
Technical analysis of this Daily chart of INTEL CORP. indicates that the overall trend is bullish. 78.57% of the signals given by moving averages are bullish. The overall trend seems to be showing some signs of weakness, as do the tentative bullish signals given by short-term moving averages. The Central Indicators scanner detects bullish and bearish signals on moving averages that could impact this trend:
Moving Average bearish crossovers : MA20 & MA50
Type : Bearish
Timeframe : Daily
Bullish price crossover with Moving Average 20
Type : Bullish
Timeframe : Daily
Bullish price crossover with Moving Average 50
Type : Bullish
Timeframe : Daily
Bullish price crossover with Moving Average 100
Type : Bullish
Timeframe : Daily
Bullish price crossover with adaptative moving average 50
Type : Bullish
Timeframe : Daily
Bullish price crossover with adaptative moving average 100
Type : Bullish
Timeframe : Daily
On the 18 technical indicators analysed, 7 are bullish, 6 are neutral and 5 are bearish. Caution: the Central Indicators scanner currently detects an excess:
Previous candle closed under Bollinger bands
Type : Neutral
Timeframe : Daily
RSI indicator: bullish divergence
Type : Bullish
Timeframe : Daily
Pivot points : price is over resistance 3
Type : Neutral
Timeframe : Daily
RSI indicator is back over 50
Type : Bullish
Timeframe : Daily
Parabolic SAR indicator bullish reversal
Type : Bullish
Timeframe : Daily
Price is back over the pivot point
Type : Bullish
Timeframe : Weekly
Williams %R indicator is back over -50
Type : Bullish
Timeframe : Daily
Central Patterns, the market scanner focusing on chart patterns, resistances and supports found these results:
Near resistance of channel
Type : Bearish
Timeframe : Daily
Horizontal resistance is broken
Type : Bullish
Timeframe : Daily
No result was found by the Central Candlesticks scanner on Japanese candlesticks.
| S3 | S2 | S1 | Price | R1 | R2 | R3 | |
|---|---|---|---|---|---|---|---|
| ProTrendLines | 28.71 | 32.79 | 33.87 | 35.51 | 36.88 | 38.86 | 40.19 |
| Change (%) | -19.15% | -7.66% | -4.62% | - | +3.86% | +9.43% | +13.18% |
| Change | -6.80 | -2.72 | -1.64 | - | +1.37 | +3.35 | +4.68 |
| Level | Minor | Major | Major | - | Minor | Minor | Intermediate |
Pivot points can also be used to set your price objectives. Here is the price situation in relation to pivot points:
| Pivot points | S3 | S2 | S1 | PP | R1 | R2 | R3 |
|---|---|---|---|---|---|---|---|
| Standard | 30.97 | 31.56 | 32.04 | 32.63 | 33.11 | 33.70 | 34.18 |
| Camarilla | 32.23 | 32.32 | 32.42 | 32.52 | 32.62 | 32.72 | 32.81 |
| Woodie | 30.92 | 31.53 | 31.99 | 32.60 | 33.06 | 33.67 | 34.13 |
| Fibonacci | 31.56 | 31.97 | 32.22 | 32.63 | 33.04 | 33.29 | 33.70 |
| Pivot points | S3 | S2 | S1 | PP | R1 | R2 | R3 |
|---|---|---|---|---|---|---|---|
| Standard | 32.14 | 33.51 | 34.21 | 35.58 | 36.28 | 37.65 | 38.35 |
| Camarilla | 34.35 | 34.54 | 34.73 | 34.92 | 35.11 | 35.30 | 35.49 |
| Woodie | 31.82 | 33.34 | 33.89 | 35.41 | 35.96 | 37.48 | 38.03 |
| Fibonacci | 33.51 | 34.30 | 34.79 | 35.58 | 36.37 | 36.86 | 37.65 |
| Pivot points | S3 | S2 | S1 | PP | R1 | R2 | R3 |
|---|---|---|---|---|---|---|---|
| Standard | 26.34 | 29.99 | 32.77 | 36.42 | 39.20 | 42.85 | 45.63 |
| Camarilla | 33.78 | 34.37 | 34.96 | 35.55 | 36.14 | 36.73 | 37.32 |
| Woodie | 25.91 | 29.77 | 32.34 | 36.20 | 38.77 | 42.63 | 45.20 |
| Fibonacci | 29.99 | 32.45 | 33.96 | 36.42 | 38.88 | 40.39 | 42.85 |
Numerical data
The following are the details of the technical indicators and moving averages that were collected to generate this technical analysis:
| RSI (14): | 52.36 | |
| MACD (12,26,9): | -0.4500 | |
| Directional Movement: | 1.37 | |
| AROON (14): | -71.43 | |
| DEMA (21): | 34.64 | |
| Parabolic SAR (0,02-0,02-0,2): | 32.15 | |
| Elder Ray (13): | 0.66 | |
| Super Trend (3,10): | 36.19 | |
| Zig ZAG (10): | 35.63 | |
| VORTEX (21): | 0.9000 | |
| Stochastique (14,3,5): | 26.92 | |
| TEMA (21): | 34.10 | |
| Williams %R (14): | -30.67 | |
| Chande Momentum Oscillator (20): | -1.20 | |
| Repulse (5,40,3): | -1.6100 | |
| ROCnROLL: | 1 | |
| TRIX (15,9): | -0.0900 | |
| Courbe Coppock: | 9.29 |
| MA7: | 34.28 | |
| MA20: | 35.48 | |
| MA50: | 35.53 | |
| MA100: | 34.70 | |
| MAexp7: | 34.40 | |
| MAexp20: | 35.11 | |
| MAexp50: | 35.20 | |
| MAexp100: | 34.34 | |
| Price / MA7: | +3.59% | |
| Price / MA20: | +0.08% | |
| Price / MA50: | -0.06% | |
| Price / MA100: | +2.33% | |
| Price / MAexp7: | +3.23% | |
| Price / MAexp20: | +1.14% | |
| Price / MAexp50: | +0.88% | |
| Price / MAexp100: | +3.41% |
News
The latest news and videos published on INTEL CORP. at the time of the analysis were as follows:
- CEVA Joins Intel Foundry Services Accelerator IP Alliance Program to Empower Cutting-Edge SoCs
- SINGER/SONGWRITER STEPHEN SANCHEZ IN PARTNERSHIP WITH LENOVO AND INTEL EVO™ KICKS OFF THE LAUNCH OF HIS DEBUT ALBUM WITH ANGEL FACE: THE LIVE VISUAL ALBUM
- Supermicro Introduces New All-in-One Open RAN System Optimized for Telco Edge Data Centers with Built-in Intel vRAN Boost
- Wondershare Filmora Takes Centre Stage at Intel Innovation Conference 2023, Demonstrating AI-Powered Features in Video Editing
- Napatech launches 5G User Plane Function offload solution on its Intel Agilex® FPGA-based 400Gbps SmartNIC
About author
Online


Add a comment
Comments
0 comments on the analysis INTEL CORP. - Daily