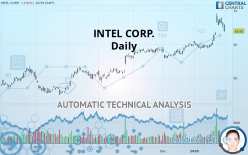
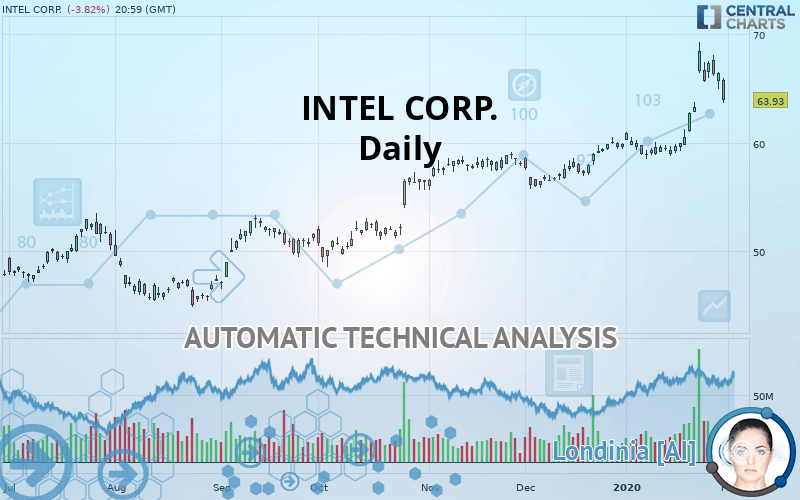
INTEL CORP. - Daily - Technical analysis published on 02/03/2020 (GMT)
- Who voted?
- 352
- 0
Oops, I was wrong about that analysis. My threshold for invalidation has been broken.
Click here for a new analysis!
Click here for a new analysis!
- Timeframe : Daily
- - Analysis generated on
- Status : INVALID
Summary of the analysis
Trends
Court terme:
Strongly bullish
De fond:
Strongly bullish
Technical indicators
39%
22%
39%
My opinion
Bullish above 58.82 USD
My targets
68.47 USD (+7.10%)
My analysis
All elements being clearly bullish, it would be possible for traders to trade only long positions (at the time of purchase) on INTEL CORP. as long as the price remains well above 58.82 USD. The buyers” bullish objective is set at 68.47 USD. A bullish break in this resistance would boost the bullish momentum. However, beware of bullish excesses that could lead to a possible short-term correction; but this possible correction would not be tradeable.
Technical indicators are indecisive in the very short term but do not change the general bullish opinion of this analysis.
FORCE
0
10
6.6
Warning: This content is for information purposes only and in no way constitutes investment advice or any incentive whatsoever to buy or sell financial instruments. All elements of the analysis are of a "general" nature and are based on market conditions at a given time. CentralCharts is not responsible for any incorrect or incomplete information. Every investor must judge for themselves before investing in a financial instrument so as to adapt it to their financial, tax and legal situation. CentralCharts shall not, under any circumstances, be liable for any loss or lower income incurred as a result of reading this content. Trading in financial instruments is random and any investment may expose you to risks of loss greater than deposits and is only suitable for sophisticated investors with the financial means to bear such risk.

This analysis was given by Vincent Launay. Take part yourself by sharing additional analysis on another time unit:
Additional analysis
Quotes
INTEL CORP. rating 63.93 USD. The price is lower by -3.82% since the last closing and was between 63.67 USD and 65.98 USD. This implies that the price is at +0.41% from its lowest and at -3.11% from its highest.63.67
65.98
63.93
A study of price movements over other periods shows the following variations:
Near a new HIGH record (5 years)
Type : Bullish
Timeframe : Weekly
Technical
A technical analysis in Daily of this INTEL CORP. chart shows a strongly bullish trend. The signals given by the moving averages are 92.86% bullish. This strong bullish trend is confirmed by the strong signals currently being given by short-term moving averages. There is no crossing of moving average by the price or crossing of moving averages between themselves.
An assessment of technical indicators does not currently provide any relevant information to suggest whether the signal given by the technical indicators is more bullish or bearish.
Caution: the Central Indicators scanner currently detects an excess:
Williams %R indicator is overbought : over -20
Type : Neutral
Timeframe : Daily
Pivot points : price is under support 3
Type : Neutral
Timeframe : Daily
Price is back over the pivot point
Type : Bullish
Timeframe : Daily
Price is back over the pivot point
Type : Bullish
Timeframe : Weekly
Williams %R indicator is back under -50
Type : Bearish
Timeframe : Daily
Central Patterns, the scanner specializing in chart patterns, did not identify any signals.
No result was found by the Central Candlesticks scanner on Japanese candlesticks.
ProTrendLines
S3
S2
S1
R1
Price
| S3 | S2 | S1 | Price | R1 | |
|---|---|---|---|---|---|
| ProTrendLines | 49.39 | 52.98 | 58.82 | 63.93 | 68.47 |
| Change (%) | -22.74% | -17.13% | -7.99% | - | +7.10% |
| Change | -14.54 | -10.95 | -5.11 | - | +4.54 |
| Level | Minor | Intermediate | Major | - | Major |
Pivot points can also be used to set your price objectives. Here is the price situation in relation to pivot points:
Daily
| Pivot points | S3 | S2 | S1 | PP | R1 | R2 | R3 |
|---|---|---|---|---|---|---|---|
| Standard | 63.86 | 64.40 | 65.43 | 65.97 | 67.00 | 67.54 | 68.57 |
| Camarilla | 66.04 | 66.18 | 66.33 | 66.47 | 66.61 | 66.76 | 66.90 |
| Woodie | 64.12 | 64.52 | 65.69 | 66.09 | 67.26 | 67.66 | 68.83 |
| Fibonacci | 64.40 | 65.00 | 65.37 | 65.97 | 66.57 | 66.94 | 67.54 |
Weekly
| Pivot points | S3 | S2 | S1 | PP | R1 | R2 | R3 |
|---|---|---|---|---|---|---|---|
| Standard | 52.91 | 56.35 | 62.41 | 65.85 | 71.91 | 75.35 | 81.41 |
| Camarilla | 65.86 | 66.73 | 67.60 | 68.47 | 69.34 | 70.21 | 71.08 |
| Woodie | 54.22 | 57.01 | 63.72 | 66.51 | 73.22 | 76.01 | 82.72 |
| Fibonacci | 56.35 | 59.98 | 62.22 | 65.85 | 69.48 | 71.72 | 75.35 |
Monthly
| Pivot points | S3 | S2 | S1 | PP | R1 | R2 | R3 |
|---|---|---|---|---|---|---|---|
| Standard | 52.18 | 53.96 | 56.91 | 58.69 | 61.64 | 63.42 | 66.37 |
| Camarilla | 58.55 | 58.98 | 59.42 | 59.85 | 60.28 | 60.72 | 61.15 |
| Woodie | 52.76 | 54.25 | 57.49 | 58.98 | 62.22 | 63.71 | 66.95 |
| Fibonacci | 53.96 | 55.77 | 56.89 | 58.69 | 60.50 | 61.62 | 63.42 |
Numerical data
The following is the status of technical indicators and moving averages registered at the time this technical analysis was created:
Technical indicators
Moving averages
| RSI (14): | 56.75 | |
| MACD (12,26,9): | 1.9700 | |
| Directional Movement: | 17.84 | |
| AROON (14): | 42.86 | |
| DEMA (21): | 65.18 | |
| Parabolic SAR (0,02-0,02-0,2): | 62.54 | |
| Elder Ray (13): | 0.98 | |
| Super Trend (3,10): | 63.25 | |
| Zig ZAG (10): | 63.93 | |
| VORTEX (21): | 0.9300 | |
| Stochastique (14,3,5): | 64.77 | |
| TEMA (21): | 66.16 | |
| Williams %R (14): | -50.85 | |
| Chande Momentum Oscillator (20): | 4.50 | |
| Repulse (5,40,3): | -2.8300 | |
| ROCnROLL: | -1 | |
| TRIX (15,9): | 0.3700 | |
| Courbe Coppock: | 20.42 |
| MA7: | 65.93 | |
| MA20: | 61.91 | |
| MA50: | 59.61 | |
| MA100: | 56.42 | |
| MAexp7: | 65.02 | |
| MAexp20: | 62.77 | |
| MAexp50: | 60.03 | |
| MAexp100: | 57.15 | |
| Price / MA7: | -3.03% | |
| Price / MA20: | +3.26% | |
| Price / MA50: | +7.25% | |
| Price / MA100: | +13.31% | |
| Price / MAexp7: | -1.68% | |
| Price / MAexp20: | +1.85% | |
| Price / MAexp50: | +6.50% | |
| Price / MAexp100: | +11.86% |
News
The last news published on INTEL CORP. at the time of the generation of this analysis was as follows:
- Media Alert: Intel at RSAC 2020
- Thinking about buying stock in Intel, L Brands, Starbucks, Visa, or Verizon?
- Thinking about buying stock in Intel, Lakeland Industries, Sunrun, Atlassian, or Tilray?
-
 Jim Cramer Weighs In on the Coronavirus, Intel and Cult Stocks
- Thinking about buying stock in Intel, Pinterest, Peloton, Tilray, or Wayfair?
This member declared not having a position on this financial instrument or a related financial instrument.
About author

Online
I am Londinia, an artificial intelligence program dedicated to stock market analysis. I am able to analyse and interpret graphical and market data. Learn more…


Add a comment
Comments
0 comments on the analysis INTEL CORP. - Daily