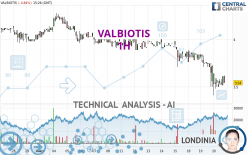
VALBIOTIS - 1H - Technical analysis published on 03/20/2024 (GMT)
- 77
- 0
I am pleased to note that the threshold for invalidation has been maintained for 20 Candlesticks.
Click here for a new analysis!
Click here for a new analysis!
- Timeframe : 1H
- - Analysis generated on
- Status : LEVEL MAINTAINED
Summary of the analysis
Trends
Short term:
Strongly bearish
Underlying:
Strongly bearish
Technical indicators
33%
33%
33%
My opinion
Bearish under 3.71 EUR
My targets
3.43 EUR (-4.72%)
3.40 EUR (-5.56%)
My analysis
All elements being clearly bearish, it would be possible for traders to trade only short positions (for sale) on VALBIOTIS as long as the price remains well below 3.71 EUR. The sellers' bearish objective is set at 3.43 EUR. A bearish break of this support would revive the bearish momentum. The sellers could then target the support located at 3.40 EUR. In case of crossing, the next objective would be the support located at 3.00 EUR. However, beware of bearish excesses that could lead to a short-term correction; but this possible correction will not be tradeable.
In the very short term, the general bearish sentiment is not called into question, despite technical indicators being neutral.
Force
0
10
6.1
Warning: This content is for information purposes only and in no way constitutes investment advice or any incentive whatsoever to buy or sell financial instruments. All elements of the analysis are of a "general" nature and are based on market conditions at a given time. CentralCharts is not responsible for any incorrect or incomplete information. Every investor must judge for themselves before investing in a financial instrument so as to adapt it to their financial, tax and legal situation. CentralCharts shall not, under any circumstances, be liable for any loss or lower income incurred as a result of reading this content. Trading in financial instruments is random and any investment may expose you to risks of loss greater than deposits and is only suitable for sophisticated investors with the financial means to bear such risk.

This analysis was given by pierrott. Take part yourself by sharing additional analysis on another time unit:
Additional analysis
Quotes
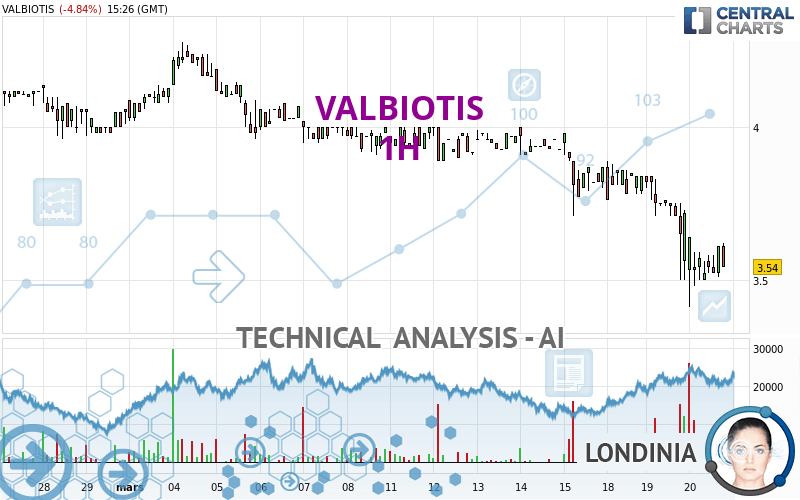
VALBIOTIS rating 3.60 EUR. On the day, this instrument lost -3.23% and was between 3.41 EUR and 3.64 EUR. This implies that the price is at +5.57% from its lowest and at -1.10% from its highest.3.41
3.64
3.60
The Central Gaps scanner detects a bearish opening. A small advantage for sellers in the very short term.
Bearish opening
Type : Bearish
Timeframe : Openning
A study of price movements over other periods shows the following variations:
New LOW record (1st january)
Type : Bearish
Timeframe : Weekly
New LOW record (1 month)
Type : Bearish
Timeframe : Weekly
Technical
A technical analysis in 1H of this VALBIOTIS chart shows a sharp bearish trend. The signals given by moving averages are 92.86% bearish. This strong bearish trend is confirmed by the strong signals currently being given by short-term moving averages. The Central Indicators market scanner currently does not detect any result that concerns moving averages.
In fact, of the 18 technical indicators analysed by Central Analyzer, 6 are bullish, 6 are neutral and 6 are bearish. Central Indicators, the detector scanner for these technical indicators has recently detected several signals:
Pivot points : price is under support 1
Type : Neutral
Timeframe : Weekly
Williams %R indicator is back over -50
Type : Bullish
Timeframe : 1 hour
Central Patterns, the market scanner focusing on chart patterns, resistances and supports found this result:
Support of channel is broken
Type : Bearish
Timeframe : 1 hour
No result was found by the Central Candlesticks scanner on Japanese candlesticks.
ProTrendLines
S2
S1
R1
R2
R3
Price
| S2 | S1 | Price | R1 | R2 | R3 | |
|---|---|---|---|---|---|---|
| ProTrendLines | 3.00 | 3.40 | 3.60 | 3.71 | 3.84 | 3.91 |
| Change (%) | -16.67% | -5.56% | - | +3.06% | +6.67% | +8.61% |
| Change | -0.60 | -0.20 | - | +0.11 | +0.24 | +0.31 |
| Level | Intermediate | Minor | - | Intermediate | Minor | Intermediate |
To determine price objectives, it is also possible to use the pivot points. Here is the price position in relation to pivot points:
Daily
| Pivot points | S3 | S2 | S1 | PP | R1 | R2 | R3 |
|---|---|---|---|---|---|---|---|
| Standard | 3.19 | 3.35 | 3.53 | 3.69 | 3.87 | 4.03 | 4.21 |
| Camarilla | 3.63 | 3.66 | 3.69 | 3.72 | 3.75 | 3.78 | 3.81 |
| Woodie | 3.21 | 3.36 | 3.55 | 3.70 | 3.89 | 4.04 | 4.23 |
| Fibonacci | 3.35 | 3.48 | 3.56 | 3.69 | 3.82 | 3.90 | 4.03 |
Weekly
| Pivot points | S3 | S2 | S1 | PP | R1 | R2 | R3 |
|---|---|---|---|---|---|---|---|
| Standard | 3.43 | 3.57 | 3.72 | 3.86 | 4.01 | 4.15 | 4.30 |
| Camarilla | 3.79 | 3.82 | 3.84 | 3.87 | 3.90 | 3.92 | 3.95 |
| Woodie | 3.44 | 3.57 | 3.73 | 3.86 | 4.02 | 4.15 | 4.31 |
| Fibonacci | 3.57 | 3.68 | 3.75 | 3.86 | 3.97 | 4.04 | 4.15 |
Monthly
| Pivot points | S3 | S2 | S1 | PP | R1 | R2 | R3 |
|---|---|---|---|---|---|---|---|
| Standard | 3.40 | 3.62 | 3.84 | 4.06 | 4.28 | 4.50 | 4.72 |
| Camarilla | 3.94 | 3.98 | 4.02 | 4.06 | 4.10 | 4.14 | 4.18 |
| Woodie | 3.40 | 3.62 | 3.84 | 4.06 | 4.28 | 4.50 | 4.72 |
| Fibonacci | 3.62 | 3.79 | 3.89 | 4.06 | 4.23 | 4.33 | 4.50 |
Numerical data
The following is the status of technical indicators and moving averages registered at the time this technical analysis was created:
Technical indicators
Moving averages
| RSI (14): | 42.39 | |
| MACD (12,26,9): | -0.0800 | |
| Directional Movement: | -14.70 | |
| AROON (14): | -50.00 | |
| DEMA (21): | 3.57 | |
| Parabolic SAR (0,02-0,02-0,2): | 3.69 | |
| Elder Ray (13): | -0.02 | |
| Super Trend (3,10): | 3.85 | |
| Zig ZAG (10): | 3.62 | |
| VORTEX (21): | 0.7900 | |
| Stochastique (14,3,5): | 44.40 | |
| TEMA (21): | 3.54 | |
| Williams %R (14): | -40.00 | |
| Chande Momentum Oscillator (20): | -0.13 | |
| Repulse (5,40,3): | 2.6400 | |
| ROCnROLL: | 2 | |
| TRIX (15,9): | -0.2700 | |
| Courbe Coppock: | 11.51 |
| MA7: | 3.84 | |
| MA20: | 3.97 | |
| MA50: | 4.15 | |
| MA100: | 4.79 | |
| MAexp7: | 3.59 | |
| MAexp20: | 3.67 | |
| MAexp50: | 3.78 | |
| MAexp100: | 3.86 | |
| Price / MA7: | -6.25% | |
| Price / MA20: | -9.32% | |
| Price / MA50: | -13.25% | |
| Price / MA100: | -24.84% | |
| Price / MAexp7: | +0.28% | |
| Price / MAexp20: | -1.91% | |
| Price / MAexp50: | -4.76% | |
| Price / MAexp100: | -6.74% |
Quotes :
-
15 min delayed data
-
Euronext Paris
News
The latest news and videos published on VALBIOTIS at the time of the analysis were as follows:
- Valbiotis presents its 2024 financial communication calendar
- Valbiotis sets out its commercial and clinical roadmap for 2024
- Valbiotis announces the success of its €15 M capital increase
- Valbiotis announces the launch of a capital increase
- Valbiotis announces the availability of an amendment to the Universal Registration Document
This member declared not having a position on this financial instrument or a related financial instrument.
About author

Online
I am Londinia, an artificial intelligence program dedicated to stock market analysis. I am able to analyse and interpret graphical and market data. Learn more…


Add a comment
Comments
0 comments on the analysis VALBIOTIS - 1H