AMERICAN EXPRESS CO. - 1H - Technical analysis published on 01/26/2024 (GMT)
- 106
- 0
- Timeframe : 1H
- - Analysis generated on
- Status : WITHOUT TARGET

Summary of the analysis

Additional analysis
Quotes
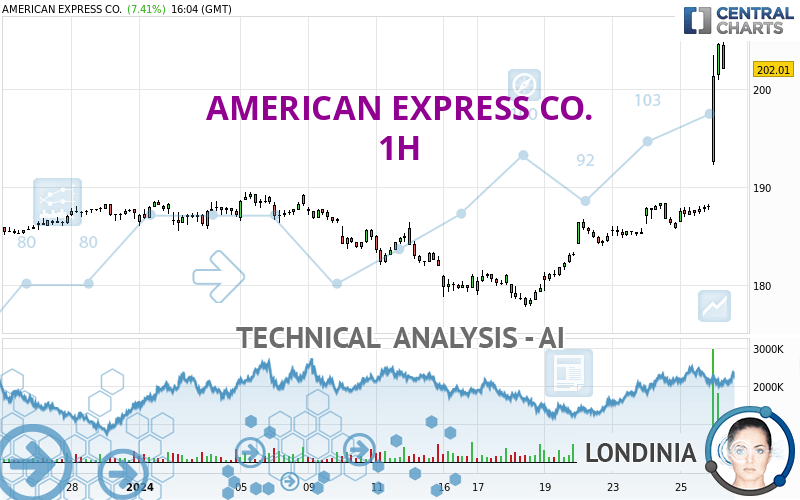
The AMERICAN EXPRESS CO. rating is 204.18 USD. The price has increased by +8.57% since the last closing with the lowest point at 192.26 USD and the highest point at 204.77 USD. The deviation from the price is +6.20% for the low point and -0.29% for the high point.The Central Gaps scanner detects the formation of a bullish gap marking the strong presence of buyers against sellers at the opening. This formed a quotation gap.
Opening Gap UP
Type : Bullish
Timeframe : Openning
A study of price movements over other periods shows the following variations:
New HIGH record (5 years)
Type : Bullish
Timeframe : Weekly
New HIGH record (1 year)
Type : Bullish
Timeframe : Weekly
New HIGH record (1st january)
Type : Bullish
Timeframe : Weekly
New HIGH record (1 month)
Type : Bullish
Timeframe : Weekly
Technical
Technical analysis of AMERICAN EXPRESS CO. in 1H shows a strongly overall bullish trend. 89.29% of the signals given by moving averages are bullish. This strongly bullish trend is supported by the strong bullish signals given by short-term moving averages. There is no crossing of moving average by the price or crossing of moving averages between themselves.
Technical indicators are strongly bullish, suggesting that the price increase should continue.
But beware of excesses. The Central Indicators scanner currently detects this:
RSI indicator is overbought : over 80
Type : Neutral
Timeframe : 1 hour
CCI indicator is overbought : over 100
Type : Neutral
Timeframe : 1 hour
Previous candle closed over Bollinger bands
Type : Neutral
Timeframe : 1 hour
Williams %R indicator is overbought : over -20
Type : Neutral
Timeframe : 1 hour
Pivot points : price is over resistance 3
Type : Neutral
Timeframe : 1 hour
Pivot points : price is over resistance 3
Type : Neutral
Timeframe : Weekly
Central Patterns, the market scanner focusing on chart patterns, resistances and supports found this result:
Resistance of channel is broken
Type : Bullish
Timeframe : 1 hour
The Central Candlesticks scanner, specialised in Japanese candlesticks, did not identify any signals.
| S3 | S2 | S1 | Price | |
|---|---|---|---|---|
| ProTrendLines | 186.42 | 189.21 | 194.36 | 204.18 |
| Change (%) | -8.70% | -7.33% | -4.81% | - |
| Change | -17.76 | -14.97 | -9.82 | - |
| Level | Major | Major | Major | - |
Attention could also be paid to pivot points to set price objectives:
| Pivot points | S3 | S2 | S1 | PP | R1 | R2 | R3 |
|---|---|---|---|---|---|---|---|
| Standard | 184.99 | 185.71 | 186.89 | 187.61 | 188.79 | 189.51 | 190.69 |
| Camarilla | 187.55 | 187.72 | 187.90 | 188.07 | 188.24 | 188.42 | 188.59 |
| Woodie | 185.22 | 185.83 | 187.12 | 187.73 | 189.02 | 189.63 | 190.92 |
| Fibonacci | 185.71 | 186.44 | 186.88 | 187.61 | 188.34 | 188.78 | 189.51 |
| Pivot points | S3 | S2 | S1 | PP | R1 | R2 | R3 |
|---|---|---|---|---|---|---|---|
| Standard | 173.96 | 175.88 | 179.53 | 181.45 | 185.10 | 187.02 | 190.67 |
| Camarilla | 181.64 | 182.15 | 182.66 | 183.17 | 183.68 | 184.19 | 184.70 |
| Woodie | 174.82 | 176.31 | 180.39 | 181.88 | 185.96 | 187.45 | 191.53 |
| Fibonacci | 175.88 | 178.01 | 179.33 | 181.45 | 183.58 | 184.90 | 187.02 |
| Pivot points | S3 | S2 | S1 | PP | R1 | R2 | R3 |
|---|---|---|---|---|---|---|---|
| Standard | 149.91 | 157.65 | 172.20 | 179.94 | 194.49 | 202.23 | 216.78 |
| Camarilla | 180.61 | 182.65 | 184.70 | 186.74 | 188.78 | 190.83 | 192.87 |
| Woodie | 153.31 | 159.35 | 175.60 | 181.64 | 197.89 | 203.93 | 220.18 |
| Fibonacci | 157.65 | 166.17 | 171.43 | 179.94 | 188.46 | 193.72 | 202.23 |
Numerical data
The following is the status of technical indicators and moving averages registered at the time this technical analysis was created:
| RSI (14): | 88.71 | |
| MACD (12,26,9): | 3.0400 | |
| Directional Movement: | 56.96 | |
| AROON (14): | 64.29 | |
| DEMA (21): | 193.15 | |
| Parabolic SAR (0,02-0,02-0,2): | 187.72 | |
| Elder Ray (13): | 11.20 | |
| Super Trend (3,10): | 195.20 | |
| Zig ZAG (10): | 204.13 | |
| VORTEX (21): | 1.2800 | |
| Stochastique (14,3,5): | 90.95 | |
| TEMA (21): | 195.07 | |
| Williams %R (14): | -4.23 | |
| Chande Momentum Oscillator (20): | 15.37 | |
| Repulse (5,40,3): | 4.9900 | |
| ROCnROLL: | 1 | |
| TRIX (15,9): | 0.1300 | |
| Courbe Coppock: | 6.69 |
| MA7: | 187.42 | |
| MA20: | 186.20 | |
| MA50: | 177.11 | |
| MA100: | 164.20 | |
| MAexp7: | 194.46 | |
| MAexp20: | 189.54 | |
| MAexp50: | 186.51 | |
| MAexp100: | 185.01 | |
| Price / MA7: | +8.94% | |
| Price / MA20: | +9.66% | |
| Price / MA50: | +15.28% | |
| Price / MA100: | +24.35% | |
| Price / MAexp7: | +5.00% | |
| Price / MAexp20: | +7.72% | |
| Price / MAexp50: | +9.47% | |
| Price / MAexp100: | +10.36% |
News
The last news published on AMERICAN EXPRESS CO. at the time of the generation of this analysis was as follows:
-
 Look ahead: UK and German consumer confidence; BOJ minutes; Core PCE; American Express
- Thinking about trading options or stock in MDC Holdings, Applied Digital, Toll Brothers, Netflix, or American Express?
- Accel-KKR to Acquire Accertify from American Express
- American Express appoints Sharon Chew as Vice President & General Manager of Global Merchant Services Asia
- American Express appoints Sharon Chew as Vice President & General Manager of Global Merchant Services Asia
About author
Online


Add a comment
Comments
0 comments on the analysis AMERICAN EXPRESS CO. - 1H