AMERICAN TOWER CORP. - 1H - Technical analysis published on 02/28/2024 (GMT)
- 329
- 0
- Timeframe : 1H
- - Analysis generated on
- Status : NEUTRAL

Summary of the analysis

Additional analysis
Quotes
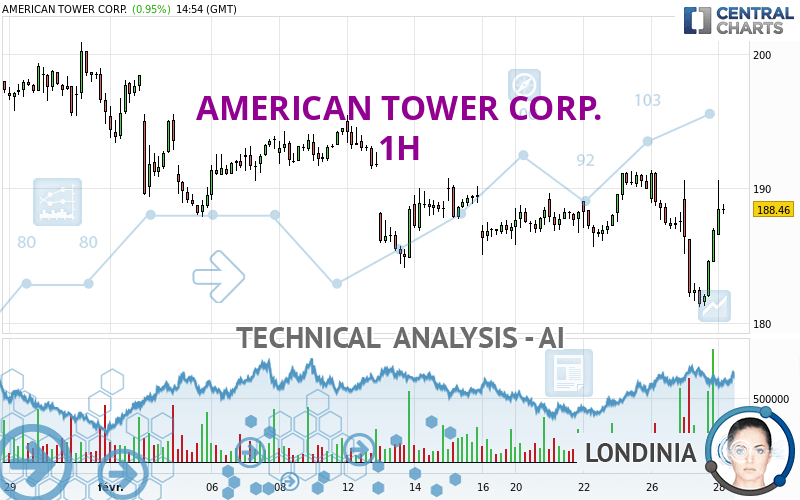
The AMERICAN TOWER CORP. rating is 189.61 USD. On the day, this instrument gained +1.57% with the lowest point at 186.50 USD and the highest point at 190.63 USD. The deviation from the price is +1.67% for the low point and -0.54% for the high point.A bearish opening was detected by the Central Gaps scanner. Sellers are trying to impose a bearish trend in the very short term.
Bearish opening
Type : Bearish
Timeframe : Openning
Here is a more detailed summary of the historical variations registered by AMERICAN TOWER CORP.:
New LOW record (1st january)
Type : Bearish
Timeframe : Weekly
New LOW record (1 month)
Type : Bearish
Timeframe : Weekly
Technical
Technical analysis of AMERICAN TOWER CORP. in 1H shows an overall slightly bearish trend. 53.57% of the signals given by moving averages are bearish. Caution: the slightly bullish signals currently given by short-term moving averages could cause a reversal of the trend. The Central Indicators market scanner is currently detecting several bullish signals that could impact this trend:
Bullish trend reversal : adaptative moving average 20
Type : Bullish
Timeframe : 1 hour
Bullish price crossover with Moving Average 20
Type : Bullish
Timeframe : 1 hour
Bullish price crossover with Moving Average 50
Type : Bullish
Timeframe : 1 hour
Bullish price crossover with Moving Average 100
Type : Bullish
Timeframe : 1 hour
Bullish price crossover with adaptative moving average 20
Type : Bullish
Timeframe : 1 hour
Bullish price crossover with adaptative moving average 50
Type : Bullish
Timeframe : 1 hour
Bullish price crossover with adaptative moving average 100
Type : Bullish
Timeframe : 1 hour
The technical indicators are generally neutral. They do not provide relevant information on the direction of future price movements.
Other results related to technical indicators were also found by the Central Indicators scanner:
MACD crosses UP its Moving Average
Type : Bullish
Timeframe : 1 hour
Parabolic SAR indicator bullish reversal
Type : Bullish
Timeframe : 1 hour
SuperTrend indicator bullish reversal
Type : Bullish
Timeframe : 1 hour
Price is back under the pivot point
Type : Bearish
Timeframe : Weekly
Momentum indicator is back over 0
Type : Bullish
Timeframe : 1 hour
An analysis of the price chart with the Central Patterns scanner (detector of chart patterns and resistances and supports) shows several results that can have an impact on the price change:
Near horizontal resistance
Type : Bearish
Timeframe : 1 hour
Resistance of channel is broken
Type : Bullish
Timeframe : 1 hour
Central Candlesticks, the scanner specialised in Japanese candlesticks, detects a bullish signal that could support the hypothesis of a small rebound in the very short term:
Three white soldiers
Type : Bullish
Timeframe : 1 hour
| S3 | S2 | S1 | Price | R1 | R2 | R3 | |
|---|---|---|---|---|---|---|---|
| ProTrendLines | 181.01 | 185.64 | 189.38 | 189.61 | 191.36 | 196.71 | 201.58 |
| Change (%) | -4.54% | -2.09% | -0.12% | - | +0.92% | +3.74% | +6.31% |
| Change | -8.60 | -3.97 | -0.23 | - | +1.75 | +7.10 | +11.97 |
| Level | Major | Intermediate | Minor | - | Intermediate | Major | Minor |
Pivot points can also be used to set your price objectives. Here is the price situation in relation to pivot points:
| Pivot points | S3 | S2 | S1 | PP | R1 | R2 | R3 |
|---|---|---|---|---|---|---|---|
| Standard | 172.24 | 176.70 | 181.69 | 186.15 | 191.14 | 195.60 | 200.59 |
| Camarilla | 184.08 | 184.95 | 185.81 | 186.68 | 187.55 | 188.41 | 189.28 |
| Woodie | 172.51 | 176.83 | 181.96 | 186.28 | 191.41 | 195.73 | 200.86 |
| Fibonacci | 176.70 | 180.31 | 182.54 | 186.15 | 189.76 | 191.99 | 195.60 |
| Pivot points | S3 | S2 | S1 | PP | R1 | R2 | R3 |
|---|---|---|---|---|---|---|---|
| Standard | 180.93 | 183.26 | 186.60 | 188.93 | 192.27 | 194.60 | 197.94 |
| Camarilla | 188.37 | 188.89 | 189.41 | 189.93 | 190.45 | 190.97 | 191.49 |
| Woodie | 181.43 | 183.51 | 187.10 | 189.18 | 192.77 | 194.85 | 198.44 |
| Fibonacci | 183.26 | 185.43 | 186.77 | 188.93 | 191.10 | 192.44 | 194.60 |
| Pivot points | S3 | S2 | S1 | PP | R1 | R2 | R3 |
|---|---|---|---|---|---|---|---|
| Standard | 162.88 | 178.82 | 187.23 | 203.17 | 211.58 | 227.52 | 235.93 |
| Camarilla | 188.95 | 191.19 | 193.42 | 195.65 | 197.88 | 200.11 | 202.35 |
| Woodie | 159.13 | 176.94 | 183.48 | 201.29 | 207.83 | 225.64 | 232.18 |
| Fibonacci | 178.82 | 188.12 | 193.87 | 203.17 | 212.47 | 218.22 | 227.52 |
Numerical data
The following are the details of the technical indicators and moving averages that were collected to generate this technical analysis:
| RSI (14): | 58.99 | |
| MACD (12,26,9): | -0.7900 | |
| Directional Movement: | 21.01 | |
| AROON (14): | -71.43 | |
| DEMA (21): | 185.55 | |
| Parabolic SAR (0,02-0,02-0,2): | 181.16 | |
| Elder Ray (13): | 2.32 | |
| Super Trend (3,10): | 181.85 | |
| Zig ZAG (10): | 189.30 | |
| VORTEX (21): | 0.9700 | |
| Stochastique (14,3,5): | 57.58 | |
| TEMA (21): | 184.99 | |
| Williams %R (14): | -16.39 | |
| Chande Momentum Oscillator (20): | 1.20 | |
| Repulse (5,40,3): | 3.3700 | |
| ROCnROLL: | 1 | |
| TRIX (15,9): | -0.0600 | |
| Courbe Coppock: | 5.10 |
| MA7: | 188.45 | |
| MA20: | 190.68 | |
| MA50: | 201.51 | |
| MA100: | 192.91 | |
| MAexp7: | 186.06 | |
| MAexp20: | 186.46 | |
| MAexp50: | 187.59 | |
| MAexp100: | 189.53 | |
| Price / MA7: | +0.62% | |
| Price / MA20: | -0.56% | |
| Price / MA50: | -5.91% | |
| Price / MA100: | -1.71% | |
| Price / MAexp7: | +1.91% | |
| Price / MAexp20: | +1.69% | |
| Price / MAexp50: | +1.08% | |
| Price / MAexp100: | +0.04% |
News
The latest news and videos published on AMERICAN TOWER CORP. at the time of the analysis were as follows:
- Investor Network: American Tower Corporation to Host Earnings Call
-
 American Tower
-
American Tower
-
Carson Block: American Tower Got in Under the Wire
About author
Online


Add a comment
Comments
0 comments on the analysis AMERICAN TOWER CORP. - 1H