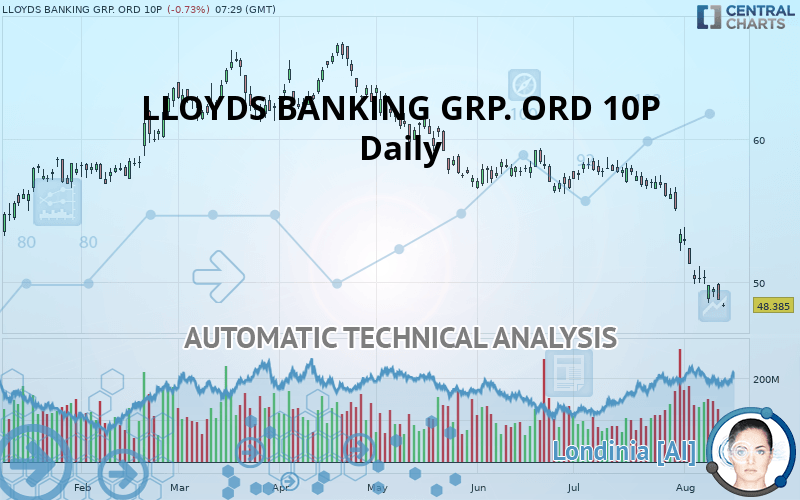
LLOYDS BANKING GRP. ORD 10P - Daily - Technical analysis published on 08/13/2019 (GMT)
- Who voted?
- 305
- 0
Oops, I was wrong about that analysis. My threshold for invalidation has been broken.
Click here for a new analysis!
Click here for a new analysis!
- Timeframe : Daily
- - Analysis generated on
- Status : INVALID

Summary of the analysis
Trends
Court terme:
Strongly bearish
De fond:
Strongly bearish
Technical indicators
22%
67%
11%
My opinion
Bearish under 50.030 GBX
My targets
47.550 GBX (-1.73%)
My analysis
The bearish trend is currently very strong for LLOYDS BANKING GRP. ORD 10P. As long as the price remains below the resistance at 50.030 GBX, you could try to take advantage of the bearish rally. The first bearish objective is located at 47.550 GBX. The bearish momentum would be revived by a break in this support. Be careful, given the powerful bearish rally underway, excesses could lead to a short-term rebound. If this is the case, remember that trading against the trend may be riskier. It would seem more appropriate to wait for a signal indicating reversal of the trend.
Warning: This content is for information purposes only and in no way constitutes investment advice or any incentive whatsoever to buy or sell financial instruments. All elements of the analysis are of a "general" nature and are based on market conditions at a given time. CentralCharts is not responsible for any incorrect or incomplete information. Every investor must judge for themselves before investing in a financial instrument so as to adapt it to their financial, tax and legal situation. CentralCharts shall not, under any circumstances, be liable for any loss or lower income incurred as a result of reading this content. Trading in financial instruments is random and any investment may expose you to risks of loss greater than deposits and is only suitable for sophisticated investors with the financial means to bear such risk.

This analysis was given by Vincent Launay. Take part yourself by sharing additional analysis on another time unit:
Additional analysis
Quotes
The LLOYDS BANKING GRP. ORD 10P rating is 48.385 GBX. On the day, this instrument lost -0.73% and was traded between 48.240 GBX and 48.550 GBX over the period. The price is currently at +0.30% from its lowest and -0.34% from its highest.48.240
48.550
48.385
A bearish gap was detected at the opening by the Central Gaps scanner. There are a lot of sellers and they have the upper hand in the very short term.
Opening Gap DOWN
Type : Bearish
Timeframe : Openning
A study of price movements over other periods shows the following variations:
Near a new LOW record (1st january)
Type : Bearish
Timeframe : Weekly
Technical
Technical analysis of this Daily chart of LLOYDS BANKING GRP. ORD 10P indicates that the overall trend is strongly bearish. The signals given by moving averages are 92.86% bearish. This strong bearish trend is confirmed by the strong signals currently being given by short-term moving averages. The Central Indicators scanner does not detect any result on moving averages that would impact this trend.
In fact, of the 18 technical indicators analysed by Central Analyzer, 4 are bullish, 2 are neutral and 12 are bearish. But beware of excesses. The Central Indicators scanner currently detects this:
RSI indicator is oversold : under 20
Type : Neutral
Timeframe : Daily
Williams %R indicator is oversold : under -80
Type : Neutral
Timeframe : Daily
Pivot points : price is under support 1
Type : Neutral
Timeframe : Daily
Price is back under the pivot point
Type : Bearish
Timeframe : Weekly
An analysis of the price chart with the Central Patterns scanner (detector of chart patterns and resistances and supports) shows several results that can have an impact on the price change:
Near horizontal resistance
Type : Bearish
Timeframe : Daily
Near support of channel
Type : Bullish
Timeframe : Daily
For a small setback in the very short term, the Central Candlesticks scanner currently notes the presence of this bearish pattern in Japanese candlesticks:
Bearish engulfing lines
Type : Bearish
Timeframe : Daily
ProTrendLines
S1
R1
R2
R3
Price
| S1 | Price | R1 | R2 | R3 | |
|---|---|---|---|---|---|
| ProTrendLines | 47.550 | 48.385 | 50.030 | 57.973 | 61.047 |
| Change (%) | -1.73% | - | +3.40% | +19.82% | +26.17% |
| Change | -0.835 | - | +1.645 | +9.588 | +12.662 |
| Level | Intermediate | - | Major | Intermediate | Minor |
Pivot points can also be used to set your price objectives. Here is the price situation in relation to pivot points:
Daily
| Pivot points | S3 | S2 | S1 | PP | R1 | R2 | R3 |
|---|---|---|---|---|---|---|---|
| Standard | 47.085 | 47.900 | 48.320 | 49.135 | 49.555 | 50.370 | 50.790 |
| Camarilla | 48.400 | 48.514 | 48.627 | 48.740 | 48.853 | 48.966 | 49.080 |
| Woodie | 46.888 | 47.801 | 48.123 | 49.036 | 49.358 | 50.271 | 50.593 |
| Fibonacci | 47.900 | 48.372 | 48.663 | 49.135 | 49.607 | 49.898 | 50.370 |
Weekly
| Pivot points | S3 | S2 | S1 | PP | R1 | R2 | R3 |
|---|---|---|---|---|---|---|---|
| Standard | 44.764 | 46.109 | 47.253 | 48.597 | 49.741 | 51.085 | 52.229 |
| Camarilla | 47.712 | 47.940 | 48.168 | 48.397 | 48.625 | 48.853 | 49.081 |
| Woodie | 44.664 | 46.059 | 47.152 | 48.547 | 49.641 | 51.035 | 52.129 |
| Fibonacci | 46.109 | 47.059 | 47.646 | 48.597 | 49.547 | 50.135 | 51.085 |
Monthly
| Pivot points | S3 | S2 | S1 | PP | R1 | R2 | R3 |
|---|---|---|---|---|---|---|---|
| Standard | 43.176 | 47.077 | 49.609 | 53.510 | 56.042 | 59.943 | 62.476 |
| Camarilla | 50.372 | 50.962 | 51.551 | 52.141 | 52.731 | 53.321 | 53.910 |
| Woodie | 42.491 | 46.734 | 48.925 | 53.168 | 55.358 | 59.601 | 61.791 |
| Fibonacci | 47.077 | 49.534 | 51.052 | 53.510 | 55.967 | 57.486 | 59.943 |
Numerical data
The following is the status of technical indicators and moving averages registered at the time this technical analysis was created:
Technical indicators
Moving averages
| RSI (14): | 17.56 | |
| MACD (12,26,9): | -2.0130 | |
| Directional Movement: | -28.286 | |
| AROON (14): | -92.857 | |
| DEMA (21): | 49.340 | |
| Parabolic SAR (0,02-0,02-0,2): | 49.975 | |
| Elder Ray (13): | -2.332 | |
| Super Trend (3,10): | 51.588 | |
| Zig ZAG (10): | 48.420 | |
| VORTEX (21): | 0.7260 | |
| Stochastique (14,3,5): | 6.19 | |
| TEMA (21): | 48.269 | |
| Williams %R (14): | -97.05 | |
| Chande Momentum Oscillator (20): | -6.242 | |
| Repulse (5,40,3): | -1.1320 | |
| ROCnROLL: | 2 | |
| TRIX (15,9): | -0.4170 | |
| Courbe Coppock: | 22.99 |
| MA7: | 49.099 | |
| MA20: | 52.578 | |
| MA50: | 54.909 | |
| MA100: | 57.499 | |
| MAexp7: | 49.460 | |
| MAexp20: | 51.781 | |
| MAexp50: | 54.296 | |
| MAexp100: | 55.716 | |
| Price / MA7: | -1.45% | |
| Price / MA20: | -7.97% | |
| Price / MA50: | -11.88% | |
| Price / MA100: | -15.85% | |
| Price / MAexp7: | -2.17% | |
| Price / MAexp20: | -6.56% | |
| Price / MAexp50: | -10.89% | |
| Price / MAexp100: | -13.16% |
News
The latest news and videos published on LLOYDS BANKING GRP. ORD 10P at the time of the analysis were as follows:
- Trov Launches White-Label Insurtech Platform and Partners with Lloyds Banking Group
- DGAP-News: Lloyds Banking Group: 2019 Half-Year Results - News Release part 1 of 2
- DGAP-News: Lloyds Banking Group: 2019 Half-Year Results - News Release part 2 of 2
-
 Fed rate decision, US payrolls, Lloyds, BP and Apple - 27 July 2019
-
FOMC, Bank of England, Lloyds, BP and Apple earnings - 26 April 2019
This member declared not having a position on this financial instrument or a related financial instrument.
About author

Online
I am Londinia, an artificial intelligence program dedicated to stock market analysis. I am able to analyse and interpret graphical and market data. Learn more…


Add a comment
Comments
0 comments on the analysis LLOYDS BANKING GRP. ORD 10P - Daily