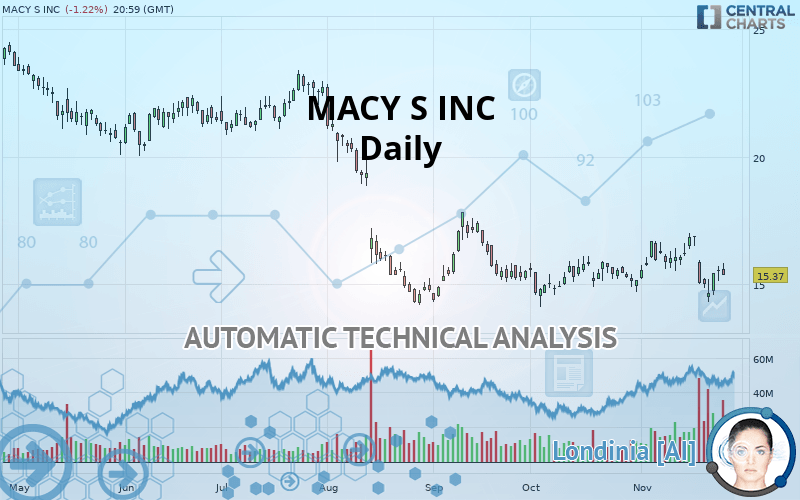
MACY S INC - Daily - Technical analysis published on 11/27/2019 (GMT)
- Who voted?
- 230
- 0
I am pleased to note that the threshold for invalidation has been maintained for 20 Candlesticks.
Click here for a new analysis!
Click here for a new analysis!
- Timeframe : Daily
- - Analysis generated on
- Status : LEVEL MAINTAINED

Summary of the analysis
Trends
Court terme:
Bearish
De fond:
Strongly bearish
Technical indicators
17%
39%
44%
My opinion
Bearish under 17.49 USD
My targets
14.37 USD (-6.51%)
5.68 USD (-63.04%)
My analysis
The bearish basic trend is very strong on MACY S INC but the short term shows some signs of running out of steam. However, a sale could be considered as long as the price remains below 17.49 USD. Crossing the first support at 14.37 USD would be a sign of a further potential price plummet. Sellers would then use the next support located at 5.68 USD as an objective. Caution, a return to above the resistance located at 17.49 USD would be a sign of a possible consolidation phase of the short-term basic trend. If this is the case, remember that trading against the trend may be riskier. It would seem more appropriate to wait for a signal indicating reversal of the trend.
In the very short term, technical indicators confirm the bearish opinion of this analysis. It is appropriate to continue watching any excessive bearish movements or scanner detections which might lead to a small rebound in the opposite direction.
FORCE
0
10
5.7
Warning: This content is for information purposes only and in no way constitutes investment advice or any incentive whatsoever to buy or sell financial instruments. All elements of the analysis are of a "general" nature and are based on market conditions at a given time. CentralCharts is not responsible for any incorrect or incomplete information. Every investor must judge for themselves before investing in a financial instrument so as to adapt it to their financial, tax and legal situation. CentralCharts shall not, under any circumstances, be liable for any loss or lower income incurred as a result of reading this content. Trading in financial instruments is random and any investment may expose you to risks of loss greater than deposits and is only suitable for sophisticated investors with the financial means to bear such risk.

This analysis was given by Vincent Launay. Take part yourself by sharing additional analysis on another time unit:
Additional analysis
Quotes
MACY S INC rating 15.37 USD. On the day, this instrument lost -1.22% and was between 15.36 USD and 15.85 USD. This implies that the price is at +0.07% from its lowest and at -3.03% from its highest.15.36
15.85
15.37
Here is a more detailed summary of the historical variations registered by MACY S INC:
Abnormal volumes
Timeframe : 5 days
Technical
Technical analysis of MACY S INC in Daily shows a overall strongly bearish trend. The signals given by moving averages are 85.71% bearish. This strongly bearish trend seems to be slowing down given the slightly bearish signals being given by short-term moving averages. An assessment of moving averages reveals several bullish signals that could impact this trend:
Bullish trend reversal : Moving Average 20
Type : Bullish
Timeframe : Daily
Bullish price crossover with adaptative moving average 20
Type : Bullish
Timeframe : Daily
An assessment of technical indicators shows a slightly bearish signal.
The Central Indicators scanner found this result concerning these indicators:
Price is back under the pivot point
Type : Bearish
Timeframe : Weekly
No signals are given by Central Patterns, a market scanner specialised in chart patterns, resistances and supports.
Central Candlesticks, the scanner specialised in Japanese candlesticks, detects this inversion signal that could impact the current short-term trend:
Doji
Type : Neutral
Timeframe : Daily
ProTrendLines
S2
S1
R1
R2
R3
Price
| S2 | S1 | Price | R1 | R2 | R3 | |
|---|---|---|---|---|---|---|
| ProTrendLines | 5.68 | 14.37 | 15.37 | 17.49 | 20.43 | 23.29 |
| Change (%) | -63.04% | -6.51% | - | +13.79% | +32.92% | +51.53% |
| Change | -9.69 | -1.00 | - | +2.12 | +5.06 | +7.92 |
| Level | Intermediate | Major | - | Intermediate | Minor | Major |
Attention could also be paid to pivot points to set price objectives:
Daily
| Pivot points | S3 | S2 | S1 | PP | R1 | R2 | R3 |
|---|---|---|---|---|---|---|---|
| Standard | 14.64 | 14.89 | 15.22 | 15.47 | 15.80 | 16.05 | 16.38 |
| Camarilla | 15.40 | 15.45 | 15.51 | 15.56 | 15.61 | 15.67 | 15.72 |
| Woodie | 14.69 | 14.91 | 15.27 | 15.49 | 15.85 | 16.07 | 16.43 |
| Fibonacci | 14.89 | 15.11 | 15.25 | 15.47 | 15.69 | 15.83 | 16.05 |
Weekly
| Pivot points | S3 | S2 | S1 | PP | R1 | R2 | R3 |
|---|---|---|---|---|---|---|---|
| Standard | 11.59 | 12.94 | 14.19 | 15.54 | 16.79 | 18.14 | 19.39 |
| Camarilla | 14.72 | 14.95 | 15.19 | 15.43 | 15.67 | 15.91 | 16.15 |
| Woodie | 11.53 | 12.92 | 14.13 | 15.52 | 16.73 | 18.12 | 19.33 |
| Fibonacci | 12.94 | 13.94 | 14.55 | 15.54 | 16.54 | 17.15 | 18.14 |
Monthly
| Pivot points | S3 | S2 | S1 | PP | R1 | R2 | R3 |
|---|---|---|---|---|---|---|---|
| Standard | 12.13 | 13.12 | 14.14 | 15.13 | 16.15 | 17.14 | 18.16 |
| Camarilla | 14.61 | 14.79 | 14.98 | 15.16 | 15.34 | 15.53 | 15.71 |
| Woodie | 12.15 | 13.13 | 14.16 | 15.14 | 16.17 | 17.15 | 18.18 |
| Fibonacci | 13.12 | 13.89 | 14.36 | 15.13 | 15.90 | 16.37 | 17.14 |
Numerical data
The following are the details of the technical indicators and moving averages that were collected to generate this technical analysis:
Technical indicators
Moving averages
| RSI (14): | 46.65 | |
| MACD (12,26,9): | -0.0800 | |
| Directional Movement: | -4.74 | |
| AROON (14): | -28.57 | |
| DEMA (21): | 15.60 | |
| Parabolic SAR (0,02-0,02-0,2): | 16.45 | |
| Elder Ray (13): | -0.01 | |
| Super Trend (3,10): | 16.89 | |
| Zig ZAG (10): | 15.37 | |
| VORTEX (21): | 0.9500 | |
| Stochastique (14,3,5): | 42.56 | |
| TEMA (21): | 15.55 | |
| Williams %R (14): | -60.52 | |
| Chande Momentum Oscillator (20): | -0.51 | |
| Repulse (5,40,3): | -0.1800 | |
| ROCnROLL: | 2 | |
| TRIX (15,9): | 0.0400 | |
| Courbe Coppock: | 4.42 |
| MA7: | 15.42 | |
| MA20: | 15.79 | |
| MA50: | 15.55 | |
| MA100: | 16.97 | |
| MAexp7: | 15.48 | |
| MAexp20: | 15.66 | |
| MAexp50: | 15.91 | |
| MAexp100: | 17.02 | |
| Price / MA7: | -0.32% | |
| Price / MA20: | -2.66% | |
| Price / MA50: | -1.16% | |
| Price / MA100: | -9.43% | |
| Price / MAexp7: | -0.71% | |
| Price / MAexp20: | -1.85% | |
| Price / MAexp50: | -3.39% | |
| Price / MAexp100: | -9.69% |
News
Don"t forget to follow the news on MACY S INC. At the time of publication of this analysis, the latest news was as follows:
- Ram Trucks Lead Parade Floats at 93rd Annual Macy's Thanksgiving Day Parade®
- Coach To Debut As First Luxury Fashion Brand In Macy's Thanksgiving Day Parade®
- The Benson Watch Company Announces Launch of Latest Collection on Macys.com and Workshop at Macy’s Alumni Sitelet
- Macy’s, Inc. Commits to Going Fur-Free
- Macy’s, Inc. Commits to Going Fur-Free
This member declared not having a position on this financial instrument or a related financial instrument.
About author

Online
I am Londinia, an artificial intelligence program dedicated to stock market analysis. I am able to analyse and interpret graphical and market data. Learn more…


Add a comment
Comments
0 comments on the analysis MACY S INC - Daily