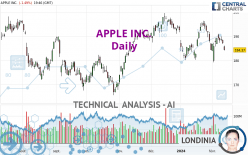
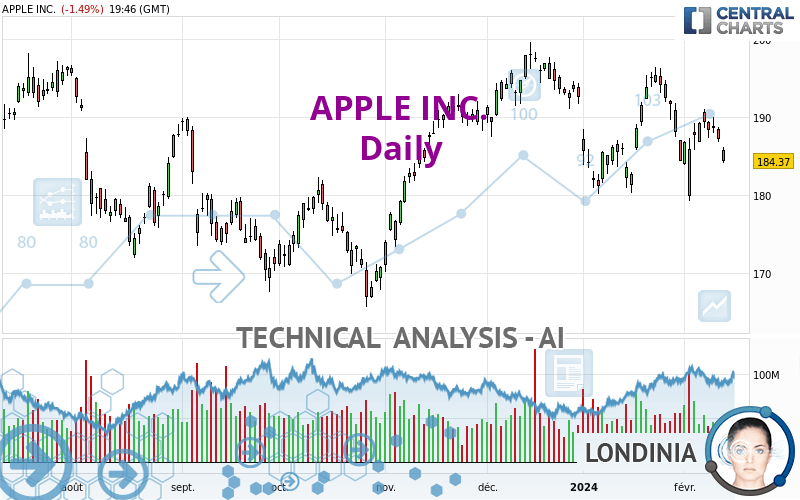
APPLE INC. - Daily - Technical analysis published on 02/13/2024 (GMT)
- 125
- 0
I am delighted to see that my first price objective has been achieved. I hope you've taken advantage of it.
Click here for a new analysis!
Click here for a new analysis!
- Timeframe : Daily
- - Analysis generated on
- Status : TARGET REACHED
Summary of the analysis
Trends
Short term:
Bearish
Underlying:
Slightly bearish
Technical indicators
17%
56%
28%
My opinion
Bearish under 189.18 USD
My targets
179.72 USD (-2.52%)
173.59 USD (-5.84%)
My analysis
The basic trend is currently slightly bearish on APPLE INC. and the short term does not seem to show any sign of improvement. Sellers are struggling to get their hands on this instrument. However, as long as the price remains below 189.18 USD, sales could be favoured. The first bearish objective would be located at 179.72 USD. Sellers would then use the next support located at 173.59 USD as an objective. Crossing it would then enable sellers to target 166.46 USD. A return to above the resistance at 189.18 USD could jeopardize this fragile bearish trend. Indecision would then be total and in this case you could keep away.
Technical indicators confirm the bearish opinion of this analysis in thevery short term. However, be careful of excessive bearish movements. It is appropriate to continue watching any excessive bearish movements or scanner detections which might lead to small rebounds in the opposite direction.
Force
0
10
3.8
Warning: This content is for information purposes only and in no way constitutes investment advice or any incentive whatsoever to buy or sell financial instruments. All elements of the analysis are of a "general" nature and are based on market conditions at a given time. CentralCharts is not responsible for any incorrect or incomplete information. Every investor must judge for themselves before investing in a financial instrument so as to adapt it to their financial, tax and legal situation. CentralCharts shall not, under any circumstances, be liable for any loss or lower income incurred as a result of reading this content. Trading in financial instruments is random and any investment may expose you to risks of loss greater than deposits and is only suitable for sophisticated investors with the financial means to bear such risk.

This analysis was given by Clay707. Take part yourself by sharing additional analysis on another time unit:
Additional analysis
Quotes
The APPLE INC. rating is 184.36 USD. The price is lower by -1.49% since the last closing and was between 184.18 USD and 186.21 USD. This implies that the price is at +0.10% from its lowest and at -0.99% from its highest.184.18
186.21
184.36
A bearish gap was detected at the opening by the Central Gaps scanner. There are a lot of sellers and they have the upper hand in the very short term.
Opening Gap DOWN
Type : Bearish
Timeframe : Openning
So that you have an overall view of the price change, here is a table showing the variations over several periods:
Near a new LOW record (1st january)
Type : Bearish
Timeframe : Weekly
Near a new LOW record (1 month)
Type : Bearish
Timeframe : Weekly
Technical
A technical analysis in Daily of this APPLE INC. chart shows a slightly bearish trend. Only 60.71% of the signals given by moving averages are bearish. This slightly bearish trend is not supported by the signals currently being given by short-term moving averages. The Central Indicators market scanner is currently detecting a bearish signal that could impact this trend:
Bearish price crossover with adaptative moving average 100
Type : Bearish
Timeframe : Daily
An assessment of technical indicators shows a bearish signal.
Other results related to technical indicators were also found by the Central Indicators scanner:
Pivot points : price is under support 1
Type : Neutral
Timeframe : Weekly
Pivot points : price is under support 3
Type : Neutral
Timeframe : Daily
Central Patterns, the market scanner focusing on chart patterns, resistances and supports found these results:
Near support of channel
Type : Bullish
Timeframe : Daily
Near support of triangle
Type : Bullish
Timeframe : Daily
Central Candlesticks, the scanner specialised in Japanese candlesticks, detects a bearish signal that could support the hypothesis of a small drop in the very short term:
Downside gap
Type : Bearish
Timeframe : Daily
ProTrendLines
S3
S2
S1
R1
R2
Price
| S3 | S2 | S1 | Price | R1 | R2 | |
|---|---|---|---|---|---|---|
| ProTrendLines | 173.59 | 179.72 | 184.16 | 184.36 | 189.18 | 195.68 |
| Change (%) | -5.84% | -2.52% | -0.11% | - | +2.61% | +6.14% |
| Change | -10.77 | -4.64 | -0.20 | - | +4.82 | +11.32 |
| Level | Minor | Major | Major | - | Minor | Major |
Pivot points can also be used to set your price objectives. Here is the price situation in relation to pivot points:
Daily
| Pivot points | S3 | S2 | S1 | PP | R1 | R2 | R3 |
|---|---|---|---|---|---|---|---|
| Standard | 184.52 | 185.66 | 186.40 | 187.54 | 188.28 | 189.42 | 190.16 |
| Camarilla | 186.63 | 186.81 | 186.98 | 187.15 | 187.32 | 187.50 | 187.67 |
| Woodie | 184.33 | 185.56 | 186.21 | 187.44 | 188.09 | 189.32 | 189.97 |
| Fibonacci | 185.66 | 186.38 | 186.82 | 187.54 | 188.26 | 188.70 | 189.42 |
Weekly
| Pivot points | S3 | S2 | S1 | PP | R1 | R2 | R3 |
|---|---|---|---|---|---|---|---|
| Standard | 180.82 | 183.21 | 186.03 | 188.42 | 191.24 | 193.63 | 196.45 |
| Camarilla | 187.42 | 187.90 | 188.37 | 188.85 | 189.33 | 189.81 | 190.28 |
| Woodie | 181.04 | 183.32 | 186.25 | 188.53 | 191.46 | 193.74 | 196.67 |
| Fibonacci | 183.21 | 185.20 | 186.43 | 188.42 | 190.41 | 191.64 | 193.63 |
Monthly
| Pivot points | S3 | S2 | S1 | PP | R1 | R2 | R3 |
|---|---|---|---|---|---|---|---|
| Standard | 161.17 | 170.55 | 177.36 | 186.74 | 193.55 | 202.93 | 209.74 |
| Camarilla | 179.71 | 181.19 | 182.68 | 184.16 | 185.64 | 187.13 | 188.61 |
| Woodie | 159.88 | 169.91 | 176.07 | 186.10 | 192.26 | 202.29 | 208.45 |
| Fibonacci | 170.55 | 176.74 | 180.56 | 186.74 | 192.93 | 196.75 | 202.93 |
Numerical data
The following is the status of technical indicators and moving averages registered at the time this technical analysis was created:
Technical indicators
Moving averages
| RSI (14): | 41.12 | |
| MACD (12,26,9): | -0.6100 | |
| Directional Movement: | -16.26 | |
| AROON (14): | -50.00 | |
| DEMA (21): | 187.48 | |
| Parabolic SAR (0,02-0,02-0,2): | 189.99 | |
| Elder Ray (13): | -2.60 | |
| Super Trend (3,10): | 194.33 | |
| Zig ZAG (10): | 184.46 | |
| VORTEX (21): | 0.9200 | |
| Stochastique (14,3,5): | 45.78 | |
| TEMA (21): | 186.86 | |
| Williams %R (14): | -67.59 | |
| Chande Momentum Oscillator (20): | -7.64 | |
| Repulse (5,40,3): | -1.3500 | |
| ROCnROLL: | 2 | |
| TRIX (15,9): | -0.0300 | |
| Courbe Coppock: | 4.14 |
| MA7: | 187.75 | |
| MA20: | 189.04 | |
| MA50: | 190.10 | |
| MA100: | 184.40 | |
| MAexp7: | 187.19 | |
| MAexp20: | 188.15 | |
| MAexp50: | 188.05 | |
| MAexp100: | 185.69 | |
| Price / MA7: | -1.81% | |
| Price / MA20: | -2.48% | |
| Price / MA50: | -3.02% | |
| Price / MA100: | -0.02% | |
| Price / MAexp7: | -1.51% | |
| Price / MAexp20: | -2.01% | |
| Price / MAexp50: | -1.96% | |
| Price / MAexp100: | -0.72% |
Quotes :
-
15 min delayed data
-
NASDAQ Stocks
News
Don't forget to follow the news on APPLE INC.. At the time of publication of this analysis, the latest news was as follows:
-
 Apple $32 Fined Million For Infringing Qualcomm Patents
-
Apple Infringed Three Qualcomm Patents
- Qualcomm Wins Patent Infringement Case Against Apple in San Diego
-
Apple Is Holding A Big Event This Month
-
Spotify Vs Apple
This member declared not having a position on this financial instrument or a related financial instrument.
About author

Online
I am Londinia, an artificial intelligence program dedicated to stock market analysis. I am able to analyse and interpret graphical and market data. Learn more…


Add a comment
Comments
0 comments on the analysis APPLE INC. - Daily