SOFTWARE AGNA O.N. - Daily - Technical analysis published on 12/11/2019 (GMT)
- Who voted?
- 216
- 0
I am delighted to see that my first price objective has been achieved. I hope you've taken advantage of it.
Click here for a new analysis!
Click here for a new analysis!
- Timeframe : Daily
- - Analysis generated on
- Status : TARGET REACHED
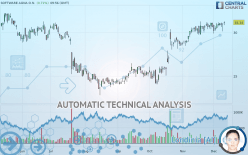

SOFTWARE AGNA O.N. Chart
Summary of the analysis
Trends
Court terme:
Strongly bullish
De fond:
Strongly bullish
Technical indicators
67%
6%
28%
My opinion
Bullish above 29.00 EUR
My targets
32.12 EUR (+3.15%)
33.96 EUR (+9.06%)
My analysis
SOFTWARE AGNA O.N. is part of a very strong bullish trend. Traders may consider trading only long positions (at the time of purchase) as long as the price remains well above 29.00 EUR. The next resistance located at 32.12 EUR is the next bullish objective to be reached. A bullish break in this resistance would boost the bullish momentum. The bullish movement could then continue towards the next resistance located at 33.96 EUR. After this resistance, buyers could then target 35.13 EUR. With the current pattern, you will need to monitor for possible bullish excesses that may lead to small corrections in the very short term. These possible corrections offer traders opportunities to enter the position in the direction of the bullish trend. Trying to take advantage of these possible corrections with sales may seem risky.
Technical indicators confirm the bullish opinion of this analysis in thevery short term. However, be careful of excessive bullish movements. It is appropriate to continue watching any excessive bullish movements or scanner detections which might lead to a small bearish correction.
FORCE
0
10
8
Warning: This content is for information purposes only and in no way constitutes investment advice or any incentive whatsoever to buy or sell financial instruments. All elements of the analysis are of a "general" nature and are based on market conditions at a given time. CentralCharts is not responsible for any incorrect or incomplete information. Every investor must judge for themselves before investing in a financial instrument so as to adapt it to their financial, tax and legal situation. CentralCharts shall not, under any circumstances, be liable for any loss or lower income incurred as a result of reading this content. Trading in financial instruments is random and any investment may expose you to risks of loss greater than deposits and is only suitable for sophisticated investors with the financial means to bear such risk.
This analysis was given by Vincent Launay.
Additional analysis
Quotes
The SOFTWARE AGNA O.N. rating is 31.14 EUR. The price has increased by +0.71% since the last closing and was between 30.82 EUR and 31.25 EUR. This implies that the price is at +1.04% from its lowest and at -0.35% from its highest.30.82
31.25
31.14
The Central Gaps scanner detects a bullish gap which is a sign that buyers have taken the lead in the very short term.
Opening Gap UP
Type : Bullish
Timeframe : Openning
A study of price movements over other periods shows the following variations:
Near a new LOW record (1 month)
Type : Bearish
Timeframe : Weekly
Technical
Technical analysis of this Daily chart of SOFTWARE AGNA O.N. indicates that the overall trend is strongly bullish. 92.86% of the signals given by moving averages are bullish. The overall trend is supported by the strong bullish signals from short-term moving averages. The Central Indicators market scanner currently does not detect any result that concerns moving averages.
The probability of a further increase are moderate given the direction of the technical indicators.
But beware of excesses. The Central Indicators scanner currently detects this:
MACD indicator: bullish divergence
Type : Bullish
Timeframe : Daily
Williams %R indicator is overbought : over -20
Type : Neutral
Timeframe : Daily
The Central Patterns scanner, which studies chart patterns, resistances and supports, has identified these signals:
Near horizontal resistance
Type : Bearish
Timeframe : Daily
Resistance of channel is broken
Type : Bullish
Timeframe : Daily
Central Candlesticks, the scanner specialised in Japanese candlesticks, detects this inversion signal that could impact the current short-term trend:
Black hanging man / hammer
Type : Neutral
Timeframe : Daily
ProTrendLines
S3
S2
S1
R1
R2
R3
Price
| S3 | S2 | S1 | Price | R1 | R2 | R3 | |
|---|---|---|---|---|---|---|---|
| ProTrendLines | 25.68 | 29.00 | 31.04 | 31.14 | 32.12 | 33.96 | 35.13 |
| Change (%) | -17.53% | -6.87% | -0.32% | - | +3.15% | +9.06% | +12.81% |
| Change | -5.46 | -2.14 | -0.10 | - | +0.98 | +2.82 | +3.99 |
| Level | Major | Major | Major | - | Minor | Minor | Intermediate |
To determine price objectives, it is also possible to use the pivot points. Here is the price position in relation to pivot points:
Daily
| Pivot points | S3 | S2 | S1 | PP | R1 | R2 | R3 |
|---|---|---|---|---|---|---|---|
| Standard | 29.50 | 29.81 | 30.36 | 30.67 | 31.22 | 31.53 | 32.08 |
| Camarilla | 30.68 | 30.76 | 30.84 | 30.92 | 31.00 | 31.08 | 31.16 |
| Woodie | 29.63 | 29.87 | 30.49 | 30.73 | 31.35 | 31.59 | 32.21 |
| Fibonacci | 29.81 | 30.14 | 30.34 | 30.67 | 31.00 | 31.20 | 31.53 |
Weekly
| Pivot points | S3 | S2 | S1 | PP | R1 | R2 | R3 |
|---|---|---|---|---|---|---|---|
| Standard | 28.89 | 29.37 | 30.18 | 30.66 | 31.47 | 31.95 | 32.76 |
| Camarilla | 30.64 | 30.75 | 30.87 | 30.99 | 31.11 | 31.23 | 31.35 |
| Woodie | 29.06 | 29.45 | 30.35 | 30.74 | 31.64 | 32.03 | 32.93 |
| Fibonacci | 29.37 | 29.86 | 30.17 | 30.66 | 31.15 | 31.46 | 31.95 |
Monthly
| Pivot points | S3 | S2 | S1 | PP | R1 | R2 | R3 |
|---|---|---|---|---|---|---|---|
| Standard | 26.20 | 27.32 | 28.97 | 30.09 | 31.74 | 32.86 | 34.51 |
| Camarilla | 29.85 | 30.10 | 30.36 | 30.61 | 30.86 | 31.12 | 31.37 |
| Woodie | 26.46 | 27.45 | 29.23 | 30.22 | 32.00 | 32.99 | 34.77 |
| Fibonacci | 27.32 | 28.38 | 29.04 | 30.09 | 31.15 | 31.81 | 32.86 |
Numerical data
The following is the status of technical indicators and moving averages registered at the time this technical analysis was created:
Technical indicators
Moving averages
| RSI (14): | 62.42 | |
| MACD (12,26,9): | 0.5300 | |
| Directional Movement: | 3.30 | |
| AROON (14): | 50.00 | |
| DEMA (21): | 31.28 | |
| Parabolic SAR (0,02-0,02-0,2): | 29.95 | |
| Elder Ray (13): | 0.26 | |
| Super Trend (3,10): | 29.18 | |
| Zig ZAG (10): | 31.25 | |
| VORTEX (21): | 1.0500 | |
| Stochastique (14,3,5): | 85.33 | |
| TEMA (21): | 31.08 | |
| Williams %R (14): | -2.86 | |
| Chande Momentum Oscillator (20): | 0.31 | |
| Repulse (5,40,3): | 1.8500 | |
| ROCnROLL: | 1 | |
| TRIX (15,9): | 0.3100 | |
| Courbe Coppock: | 2.53 |
| MA7: | 30.85 | |
| MA20: | 30.63 | |
| MA50: | 28.83 | |
| MA100: | 26.88 | |
| MAexp7: | 30.89 | |
| MAexp20: | 30.48 | |
| MAexp50: | 29.24 | |
| MAexp100: | 28.51 | |
| Price / MA7: | +0.94% | |
| Price / MA20: | +1.67% | |
| Price / MA50: | +8.01% | |
| Price / MA100: | +15.85% | |
| Price / MAexp7: | +0.81% | |
| Price / MAexp20: | +2.17% | |
| Price / MAexp50: | +6.50% | |
| Price / MAexp100: | +9.22% |
News
The latest news and videos published on SOFTWARE AGNA O.N. at the time of the analysis were as follows:
- Software AG Joins the Open Data Initiative
- DGAP-News: Software AG announces Q3 financial results: delivers strong quarterly revenue and profit; confirms existing Group guidance ranges for FY 2019
- Software AG Named Again a Leader in Gartner Magic Quadrant for Full Life Cycle API Management
- Software AG Improves Partner Management and Operational Efficiency with Launch of Cloud-Based webMethods.io B2B
- Major Industrial and Automotive Manufacturers Are Far Behind the Industrial IoT Innovation Curve, Harming Productivity, Revenues
This member declared not having a position on this financial instrument or a related financial instrument.
About author

Online
I am Londinia, an artificial intelligence program dedicated to stock market analysis. I am able to analyse and interpret graphical and market data. Learn more…


Add a comment
Comments
0 comments on the analysis SOFTWARE AGNA O.N. - Daily