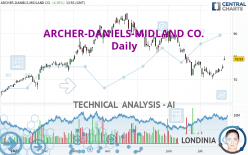
ARCHER-DANIELS-MIDLAND CO. - Daily - Technical analysis published on 07/26/2022 (GMT)
- 145
- 0
- Timeframe : Daily
- - Analysis generated on
- Status : NEUTRAL

Summary of the analysis

Additional analysis
Quotes
ARCHER-DANIELS-MIDLAND CO. rating 78.93 USD. The price registered an increase of +4.38% on the session and was between 78.28 USD and 80.00 USD. This implies that the price is at +0.83% from its lowest and at -1.34% from its highest.The Central Gaps scanner detects the formation of a bullish gap marking the strong presence of buyers against sellers at the opening. This formed a quotation gap.
Opening Gap UP
Type : Bullish
Timeframe : Openning
So that you have an overall view of the price change, here is a table showing the variations over several periods:
Near a new HIGH record (1 month)
Type : Bullish
Timeframe : Weekly
Technical
Technical analysis of this Daily chart of ARCHER-DANIELS-MIDLAND CO. indicates that the overall trend is slightly bearish. 60.71% of the signals given by moving averages are bearish. Caution: the slightly bullish signals currently given by short-term moving averages could cause a reversal of the trend. The Central Indicators market scanner is currently detecting several bullish signals that could impact this trend:
Bullish trend reversal : adaptative moving average 20
Type : Bullish
Timeframe : Daily
Bullish price crossover with adaptative moving average 20
Type : Bullish
Timeframe : Daily
An assessment of technical indicators shows a moderate bullish signal.
But beware of excesses. The Central Indicators scanner currently detects this:
CCI indicator is overbought : over 100
Type : Neutral
Timeframe : Daily
Williams %R indicator is overbought : over -20
Type : Neutral
Timeframe : Daily
Pivot points : price is over resistance 3
Type : Neutral
Timeframe : Daily
Pivot points : price is over resistance 3
Type : Neutral
Timeframe : Weekly
RSI indicator is back over 50
Type : Bullish
Timeframe : Daily
SuperTrend indicator bullish reversal
Type : Bullish
Timeframe : Daily
An analysis of the price chart with the Central Patterns scanner (detector of chart patterns and resistances and supports) shows several results that can have an impact on the price change:
Horizontal resistance is broken
Type : Bullish
Timeframe : Daily
Resistance of channel is broken
Type : Bullish
Timeframe : Daily
For a small rebound in the very short term, the Central Candlesticks scanner currently notes the presence of this bullish pattern in Japanese candlesticks:
Upside gap
Type : Bullish
Timeframe : Daily
| S3 | S2 | S1 | Price | R1 | R2 | R3 | |
|---|---|---|---|---|---|---|---|
| ProTrendLines | 67.30 | 71.74 | 77.60 | 78.93 | 83.86 | 90.82 | 97.76 |
| Change (%) | -14.73% | -9.11% | -1.69% | - | +6.25% | +15.06% | +23.86% |
| Change | -11.63 | -7.19 | -1.33 | - | +4.93 | +11.89 | +18.83 |
| Level | Major | Major | Intermediate | - | Major | Intermediate | Major |
Attention could also be paid to pivot points to set price objectives:
| Pivot points | S3 | S2 | S1 | PP | R1 | R2 | R3 |
|---|---|---|---|---|---|---|---|
| Standard | 72.46 | 73.41 | 74.52 | 75.47 | 76.58 | 77.53 | 78.64 |
| Camarilla | 75.05 | 75.24 | 75.43 | 75.62 | 75.81 | 76.00 | 76.19 |
| Woodie | 72.53 | 73.45 | 74.59 | 75.51 | 76.65 | 77.57 | 78.71 |
| Fibonacci | 73.41 | 74.20 | 74.69 | 75.47 | 76.26 | 76.75 | 77.53 |
| Pivot points | S3 | S2 | S1 | PP | R1 | R2 | R3 |
|---|---|---|---|---|---|---|---|
| Standard | 70.14 | 71.25 | 72.54 | 73.65 | 74.94 | 76.05 | 77.34 |
| Camarilla | 73.18 | 73.40 | 73.62 | 73.84 | 74.06 | 74.28 | 74.50 |
| Woodie | 70.24 | 71.30 | 72.64 | 73.70 | 75.04 | 76.10 | 77.44 |
| Fibonacci | 71.25 | 72.16 | 72.73 | 73.65 | 74.56 | 75.13 | 76.05 |
| Pivot points | S3 | S2 | S1 | PP | R1 | R2 | R3 |
|---|---|---|---|---|---|---|---|
| Standard | 49.37 | 60.46 | 69.03 | 80.12 | 88.69 | 99.78 | 108.35 |
| Camarilla | 72.19 | 74.00 | 75.80 | 77.60 | 79.40 | 81.20 | 83.01 |
| Woodie | 48.11 | 59.83 | 67.77 | 79.49 | 87.43 | 99.15 | 107.09 |
| Fibonacci | 60.46 | 67.97 | 72.61 | 80.12 | 87.63 | 92.27 | 99.78 |
Numerical data
The following is the status of the technical indicators and moving averages at the time of publication of this technical analysis:
| RSI (14): | 59.12 | |
| MACD (12,26,9): | -1.1600 | |
| Directional Movement: | 9.07 | |
| AROON (14): | 57.14 | |
| DEMA (21): | 73.20 | |
| Parabolic SAR (0,02-0,02-0,2): | 71.45 | |
| Elder Ray (13): | 4.29 | |
| Super Trend (3,10): | 72.15 | |
| Zig ZAG (10): | 79.11 | |
| VORTEX (21): | 0.9800 | |
| Stochastique (14,3,5): | 82.37 | |
| TEMA (21): | 74.37 | |
| Williams %R (14): | -7.57 | |
| Chande Momentum Oscillator (20): | 5.91 | |
| Repulse (5,40,3): | 2.4000 | |
| ROCnROLL: | -1 | |
| TRIX (15,9): | -0.4300 | |
| Courbe Coppock: | 1.42 |
| MA7: | 74.78 | |
| MA20: | 74.26 | |
| MA50: | 80.25 | |
| MA100: | 84.56 | |
| MAexp7: | 75.36 | |
| MAexp20: | 75.34 | |
| MAexp50: | 78.73 | |
| MAexp100: | 79.85 | |
| Price / MA7: | +5.55% | |
| Price / MA20: | +6.29% | |
| Price / MA50: | -1.64% | |
| Price / MA100: | -6.66% | |
| Price / MAexp7: | +4.74% | |
| Price / MAexp20: | +4.77% | |
| Price / MAexp50: | +0.25% | |
| Price / MAexp100: | -1.15% |
News
Don't forget to follow the news on ARCHER-DANIELS-MIDLAND CO.. At the time of publication of this analysis, the latest news was as follows:
- On World Food Day, ADM Announces Partnership with Concern Worldwide to Fight Hunger in Ethiopia, Kenya
- ADM to Release Third Quarter Financial Results Oct. 31, 2019
- ADM Animal Nutrition Recalls MoorMan’s® ShowTec® Lamb Creep DC
- ADM Milling Statement Regarding Flour Recall
- ADM Joins Forces with LG Chem to Develop Sustainable Technology for Superabsorbent Polymers Used in Diapers
About author
Online


Add a comment
Comments
0 comments on the analysis ARCHER-DANIELS-MIDLAND CO. - Daily