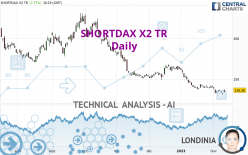
SHORTDAX X2 TR - Daily - Technical analysis published on 02/10/2023 (GMT)
- 106
- 0
Click here for a new analysis!
- Timeframe : Daily
- - Analysis generated on
- Status : TARGET REACHED

Summary of the analysis

Additional analysis
Quotes
The SHORTDAX X2 TR price is 136.36 EUR. On the day, this instrument gained +2.77% and was traded between 133.31 EUR and 137.44 EUR over the period. The price is currently at +2.29% from its lowest and -0.79% from its highest.The Central Gaps scanner detects the formation of a bullish gap marking the strong presence of buyers against sellers at the opening. This formed a quotation gap.
Opening Gap UP
Type : Bullish
Timeframe : Openning
Here is a more detailed summary of the historical variations registered by SHORTDAX X2 TR:
New LOW record (5 years)
Type : Bearish
Timeframe : Weekly
Near a new LOW record (1 year)
Type : Bearish
Timeframe : Weekly
Near a new LOW record (1st january)
Type : Bearish
Timeframe : Weekly
Near a new HIGH record (1 month)
Type : Bullish
Timeframe : Weekly
Technical
A technical analysis in Daily of this SHORTDAX X2 TR chart shows a sharp bearish trend. 92.86% of the signals given by moving averages are bearish. This strongly bearish trend is supported by the strong bearish signals given by short-term moving averages. There is no crossing of moving average by the price or crossing of moving averages between themselves.
In fact, according to the parameters integrated into the Central Analyzer system, only 9 technical indicators out of 18 analysed are currently bullish. But beware of excesses. The Central Indicators scanner currently detects this:
CCI indicator: bullish divergence
Type : Bullish
Timeframe : Daily
MACD indicator: bullish divergence
Type : Bullish
Timeframe : Daily
Pivot points : price is over resistance 3
Type : Neutral
Timeframe : Daily
Price is back over the pivot point
Type : Bullish
Timeframe : Weekly
Williams %R indicator is back over -50
Type : Bullish
Timeframe : Daily
The analysis of the price chart with Central Patterns scanners does not return any result.
For a small rebound in the very short term, the Central Candlesticks scanner currently notes the presence of this bullish pattern in Japanese candlesticks:
Upside gap
Type : Bullish
Timeframe : Daily
| Price | R1 | R2 | R3 | |
|---|---|---|---|---|
| ProTrendLines | 136.36 | 151.96 | 171.37 | 187.59 |
| Change (%) | - | +11.44% | +25.67% | +37.57% |
| Change | - | +15.60 | +35.01 | +51.23 |
| Level | - | Intermediate | Intermediate | Minor |
To determine price objectives, it is also possible to use the pivot points. Here is the price position in relation to pivot points:
| Pivot points | S3 | S2 | S1 | PP | R1 | R2 | R3 |
|---|---|---|---|---|---|---|---|
| Standard | 128.65 | 129.49 | 131.08 | 131.92 | 133.51 | 134.35 | 135.94 |
| Camarilla | 132.01 | 132.24 | 132.46 | 132.68 | 132.90 | 133.13 | 133.35 |
| Woodie | 129.04 | 129.68 | 131.47 | 132.11 | 133.90 | 134.54 | 136.33 |
| Fibonacci | 129.49 | 130.42 | 130.99 | 131.92 | 132.85 | 133.42 | 134.35 |
| Pivot points | S3 | S2 | S1 | PP | R1 | R2 | R3 |
|---|---|---|---|---|---|---|---|
| Standard | 120.26 | 126.45 | 129.95 | 136.14 | 139.64 | 145.83 | 149.33 |
| Camarilla | 130.78 | 131.66 | 132.55 | 133.44 | 134.33 | 135.22 | 136.11 |
| Woodie | 118.91 | 125.78 | 128.60 | 135.47 | 138.29 | 145.16 | 147.98 |
| Fibonacci | 126.45 | 130.16 | 132.44 | 136.14 | 139.85 | 142.13 | 145.83 |
| Pivot points | S3 | S2 | S1 | PP | R1 | R2 | R3 |
|---|---|---|---|---|---|---|---|
| Standard | 103.19 | 120.13 | 129.97 | 146.91 | 156.75 | 173.69 | 183.53 |
| Camarilla | 132.44 | 134.89 | 137.35 | 139.80 | 142.26 | 144.71 | 147.17 |
| Woodie | 99.63 | 118.36 | 126.41 | 145.14 | 153.19 | 171.92 | 179.97 |
| Fibonacci | 120.13 | 130.36 | 136.68 | 146.91 | 157.14 | 163.46 | 173.69 |
Numerical data
The following are the details of the technical indicators and moving averages that were collected to generate this technical analysis:
| RSI (14): | 40.53 | |
| MACD (12,26,9): | -4.2100 | |
| Directional Movement: | -14.29 | |
| AROON (14): | -78.57 | |
| DEMA (21): | 133.15 | |
| Parabolic SAR (0,02-0,02-0,2): | 141.23 | |
| Elder Ray (13): | -1.61 | |
| Super Trend (3,10): | 140.84 | |
| Zig ZAG (10): | 136.84 | |
| VORTEX (21): | 0.8000 | |
| Stochastique (14,3,5): | 30.19 | |
| TEMA (21): | 133.42 | |
| Williams %R (14): | -47.00 | |
| Chande Momentum Oscillator (20): | -3.74 | |
| Repulse (5,40,3): | 3.2500 | |
| ROCnROLL: | -1 | |
| TRIX (15,9): | -0.4600 | |
| Courbe Coppock: | 7.44 |
| MA7: | 134.61 | |
| MA20: | 138.10 | |
| MA50: | 149.14 | |
| MA100: | 167.51 | |
| MAexp7: | 135.58 | |
| MAexp20: | 139.00 | |
| MAexp50: | 148.21 | |
| MAexp100: | 159.64 | |
| Price / MA7: | +1.30% | |
| Price / MA20: | -1.26% | |
| Price / MA50: | -8.57% | |
| Price / MA100: | -18.60% | |
| Price / MAexp7: | +0.58% | |
| Price / MAexp20: | -1.90% | |
| Price / MAexp50: | -8.00% | |
| Price / MAexp100: | -14.58% |
About author
Online


Add a comment
Comments
0 comments on the analysis SHORTDAX X2 TR - Daily