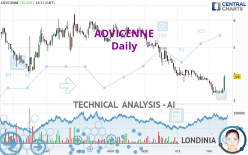
ADVICENNE - Daily - Technical analysis published on 11/15/2022 (GMT)
- 137
- 0
Click here for a new analysis!
- Timeframe : Daily
- - Analysis generated on
- Status : TARGET REACHED

Summary of the analysis

Additional analysis
Quotes
The ADVICENNE rating is 3.900 EUR. The price has increased by +15.21% since the last closing and was traded between 3.370 EUR and 3.950 EUR over the period. The price is currently at +15.73% from its lowest and -1.27% from its highest.So that you have an overall view of the price change, here is a table showing the variations over several periods:
Near a new LOW record (5 years)
Type : Bearish
Timeframe : Weekly
Technical
A technical analysis in Daily of this ADVICENNE chart shows a bearish trend. 75.00% of the signals given by moving averages are bearish. Caution: as the signals currently given by short-term moving averages are rather neutral, the bearish trend could slow down. The Central Indicators scanner detects bullish signals on moving averages that could impact this trend:
Bullish price crossover with Moving Average 20
Type : Bullish
Timeframe : Daily
Bullish price crossover with adaptative moving average 20
Type : Bullish
Timeframe : Daily
Bullish price crossover with adaptative moving average 50
Type : Bullish
Timeframe : Daily
Technical indicators are slightly bullish. There is therefore considerable uncertainty about the continuation of the increase.
Caution: the Central Indicators scanner currently detects an excess:
Williams %R indicator is overbought : over -20
Type : Neutral
Timeframe : Daily
Pivot points : price is over resistance 3
Type : Neutral
Timeframe : Daily
Pivot points : price is over resistance 3
Type : Neutral
Timeframe : Weekly
RSI indicator is back over 50
Type : Bullish
Timeframe : Daily
Parabolic SAR indicator bullish reversal
Type : Bullish
Timeframe : Daily
Aroon indicator bullish trend
Type : Bullish
Timeframe : Daily
SuperTrend indicator bullish reversal
Type : Bullish
Timeframe : Daily
Momentum indicator is back over 0
Type : Bullish
Timeframe : Daily
The analysis of the price chart with Central Patterns scanners does not return any result.
The presence of a bullish Japanese candlestick pattern detected by Central Candlesticks that could cause a very short term rebound was also detected:
Long white line
Type : Bullish
Timeframe : Daily
| S1 | Price | R1 | R2 | R3 | |
|---|---|---|---|---|---|
| ProTrendLines | 3.300 | 3.900 | 4.115 | 5.194 | 5.711 |
| Change (%) | -15.38% | - | +5.51% | +33.18% | +46.44% |
| Change | -0.600 | - | +0.215 | +1.294 | +1.811 |
| Level | Major | - | Major | Minor | Intermediate |
Attention could also be paid to pivot points to set price objectives:
| Pivot points | S3 | S2 | S1 | PP | R1 | R2 | R3 |
|---|---|---|---|---|---|---|---|
| Standard | 3.057 | 3.158 | 3.272 | 3.373 | 3.487 | 3.588 | 3.702 |
| Camarilla | 3.326 | 3.346 | 3.365 | 3.385 | 3.405 | 3.424 | 3.444 |
| Woodie | 3.063 | 3.161 | 3.278 | 3.376 | 3.493 | 3.591 | 3.708 |
| Fibonacci | 3.158 | 3.241 | 3.291 | 3.373 | 3.456 | 3.506 | 3.588 |
| Pivot points | S3 | S2 | S1 | PP | R1 | R2 | R3 |
|---|---|---|---|---|---|---|---|
| Standard | 2.948 | 3.107 | 3.203 | 3.362 | 3.458 | 3.617 | 3.713 |
| Camarilla | 3.230 | 3.253 | 3.277 | 3.300 | 3.323 | 3.347 | 3.370 |
| Woodie | 2.918 | 3.091 | 3.173 | 3.346 | 3.428 | 3.601 | 3.683 |
| Fibonacci | 3.107 | 3.204 | 3.264 | 3.362 | 3.459 | 3.519 | 3.617 |
| Pivot points | S3 | S2 | S1 | PP | R1 | R2 | R3 |
|---|---|---|---|---|---|---|---|
| Standard | 3.013 | 3.357 | 3.563 | 3.907 | 4.113 | 4.457 | 4.663 |
| Camarilla | 3.619 | 3.669 | 3.720 | 3.770 | 3.820 | 3.871 | 3.921 |
| Woodie | 2.945 | 3.323 | 3.495 | 3.873 | 4.045 | 4.423 | 4.595 |
| Fibonacci | 3.357 | 3.567 | 3.697 | 3.907 | 4.117 | 4.247 | 4.457 |
Numerical data
The following is the status of technical indicators and moving averages registered at the time this technical analysis was created:
| RSI (14): | 56.33 | |
| MACD (12,26,9): | -0.1880 | |
| Directional Movement: | 6.130 | |
| AROON (14): | 57.143 | |
| DEMA (21): | 3.354 | |
| Parabolic SAR (0,02-0,02-0,2): | 3.200 | |
| Elder Ray (13): | 0.121 | |
| Super Trend (3,10): | 3.057 | |
| Zig ZAG (10): | 3.895 | |
| VORTEX (21): | 0.7920 | |
| Stochastique (14,3,5): | 44.59 | |
| TEMA (21): | 3.398 | |
| Williams %R (14): | -7.33 | |
| Chande Momentum Oscillator (20): | 0.125 | |
| Repulse (5,40,3): | 17.1590 | |
| ROCnROLL: | -1 | |
| TRIX (15,9): | -0.8270 | |
| Courbe Coppock: | 20.56 |
| MA7: | 3.411 | |
| MA20: | 3.615 | |
| MA50: | 4.097 | |
| MA100: | 4.807 | |
| MAexp7: | 3.511 | |
| MAexp20: | 3.629 | |
| MAexp50: | 4.059 | |
| MAexp100: | 4.581 | |
| Price / MA7: | +14.34% | |
| Price / MA20: | +7.88% | |
| Price / MA50: | -4.81% | |
| Price / MA100: | -18.87% | |
| Price / MAexp7: | +11.08% | |
| Price / MAexp20: | +7.47% | |
| Price / MAexp50: | -3.92% | |
| Price / MAexp100: | -14.87% |
News
The latest news and videos published on ADVICENNE at the time of the analysis were as follows:
- Advicenne Announces Its Upcoming Participation in Two of the Most Important International Investor Conferences
- Advicenne Announces the Extension of the Intellectual Property of Its Drug Sibnayal®
- Advicenne Reports Its First Half Financial Results as of June 30, 2022
- Advicenne Updates on Availability of Sibnayal® to Patients and Caregivers in Great Britain
- Advicenne Announces Commercial Launch of Sibnayal® in Great Britain
About author
Online


Add a comment
Comments
0 comments on the analysis ADVICENNE - Daily