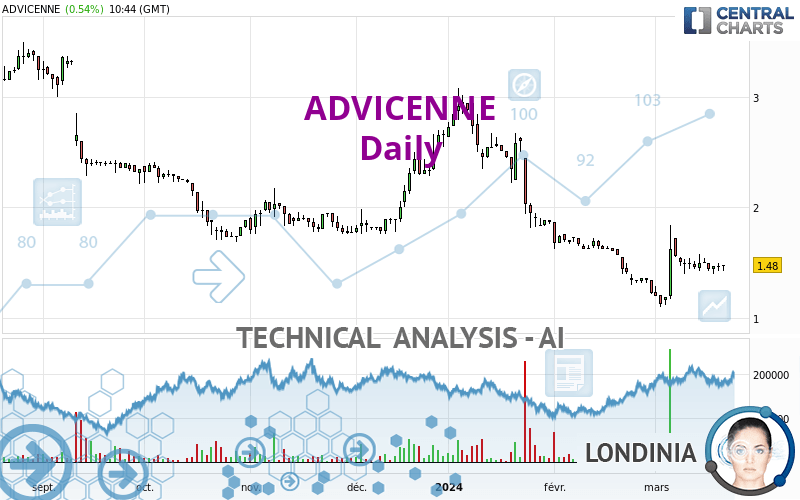
ADVICENNE - Daily - Technical analysis published on 03/21/2024 (GMT)
- 85
- 0
Oops, I was wrong about that analysis. My threshold for invalidation has been broken.
Click here for a new analysis!
Click here for a new analysis!
- Timeframe : Daily
- - Analysis generated on
- Status : INVALID

Summary of the analysis
Trends
Short term:
Neutral
Underlying:
Strongly bearish
Technical indicators
50%
0%
50%
My opinion
Bearish under 1.620 EUR
My targets
1.437 EUR (-2.93%)
1.317 EUR (-11.03%)
My analysis
With a strongly bearish trend, the price of ADVICENNE is trying to inflate a little while more or less stagnating in the short term. Is the price preparing for a rebound or a bearish rally recovery? Sellers' generally have the upper hand, even if a small correction (not tradeable) on the resistance located at 1.620 EUR remains possible. It would be possible for traders to only trade short positions (for sale) on ADVICENNE as long as the price remains well below 1.620 EUR. The next bearish objective for sellers is set at 1.437 EUR. A bearish break of this support would revive the bearish momentum. The sellers could then target the support located at 1.317 EUR. In case of crossing, the next objective would be the support located at 1.130 EUR.
In the very short term, the general bearish opinion of this analysis is in opposition with technical indicators. As long as the invalidation level of this analysis is not breached, the bearish direction is still favored, however the current short term correction should be carefully watched.
Force
0
10
2.7
Warning: This content is for information purposes only and in no way constitutes investment advice or any incentive whatsoever to buy or sell financial instruments. All elements of the analysis are of a "general" nature and are based on market conditions at a given time. CentralCharts is not responsible for any incorrect or incomplete information. Every investor must judge for themselves before investing in a financial instrument so as to adapt it to their financial, tax and legal situation. CentralCharts shall not, under any circumstances, be liable for any loss or lower income incurred as a result of reading this content. Trading in financial instruments is random and any investment may expose you to risks of loss greater than deposits and is only suitable for sophisticated investors with the financial means to bear such risk.

This analysis was given by pierrott. Take part yourself by sharing additional analysis on another time unit:
Additional analysis
Quotes
ADVICENNE rating 1.480 EUR. The price registered an increase of +0.54% on the session with the lowest point at 1.422 EUR and the highest point at 1.484 EUR. The deviation from the price is +4.08% for the low point and -0.27% for the high point.1.422
1.484
1.480
The Central Gaps scanner detects a bullish opening marking the presence of buyers ahead of sellers at the opening but not sufficiently marked to allow the price to register a quotation gap.
Bullish opening
Type : Bullish
Timeframe : Openning
Here is a more detailed summary of the historical variations registered by ADVICENNE:
Abnormal volumes
Timeframe : 20 days
Technical
A technical analysis in Daily of this ADVICENNE chart shows a sharp bearish trend. 82.14% of the signals given by moving averages are bearish. Caution: as the signals currently given by short-term moving averages are rather neutral, the global trend is slowing down. The Central Indicators market scanner is currently detecting a bullish signal that could impact this trend:
Bullish trend reversal : Moving Average 20
Type : Bullish
Timeframe : Daily
In fact, only 9 technical indicators out of 18 studied are currently bullish. No additional result has been identified by Central Indicators, the scanner specialised in technical indicators.
Central Patterns, the scanner specializing in chart patterns, did not identify any signals.
There is also a Japanese candlestick pattern detected by Central Candlesticks that could mark the end of the current short-term trend:
Doji
Type : Neutral
Timeframe : Daily
ProTrendLines
S1
R1
R2
R3
Price
| S1 | Price | R1 | R2 | R3 | |
|---|---|---|---|---|---|
| ProTrendLines | 1.130 | 1.480 | 1.620 | 2.920 | 3.333 |
| Change (%) | -23.65% | - | +9.46% | +97.30% | +125.20% |
| Change | -0.350 | - | +0.140 | +1.440 | +1.853 |
| Level | Major | - | Intermediate | Intermediate | Intermediate |
Attention could also be paid to pivot points to set price objectives:
Daily
| Pivot points | S3 | S2 | S1 | PP | R1 | R2 | R3 |
|---|---|---|---|---|---|---|---|
| Standard | 1.360 | 1.392 | 1.432 | 1.464 | 1.504 | 1.536 | 1.576 |
| Camarilla | 1.452 | 1.459 | 1.465 | 1.472 | 1.479 | 1.485 | 1.492 |
| Woodie | 1.364 | 1.394 | 1.436 | 1.466 | 1.508 | 1.538 | 1.580 |
| Fibonacci | 1.392 | 1.420 | 1.437 | 1.464 | 1.492 | 1.509 | 1.536 |
Weekly
| Pivot points | S3 | S2 | S1 | PP | R1 | R2 | R3 |
|---|---|---|---|---|---|---|---|
| Standard | 1.233 | 1.317 | 1.413 | 1.497 | 1.593 | 1.677 | 1.773 |
| Camarilla | 1.461 | 1.477 | 1.494 | 1.510 | 1.527 | 1.543 | 1.560 |
| Woodie | 1.240 | 1.320 | 1.420 | 1.500 | 1.600 | 1.680 | 1.780 |
| Fibonacci | 1.317 | 1.385 | 1.428 | 1.497 | 1.565 | 1.608 | 1.677 |
Monthly
| Pivot points | S3 | S2 | S1 | PP | R1 | R2 | R3 |
|---|---|---|---|---|---|---|---|
| Standard | 0.347 | 0.781 | 1.003 | 1.437 | 1.659 | 2.093 | 2.315 |
| Camarilla | 1.046 | 1.106 | 1.166 | 1.226 | 1.286 | 1.346 | 1.406 |
| Woodie | 0.242 | 0.728 | 0.898 | 1.384 | 1.554 | 2.040 | 2.210 |
| Fibonacci | 0.781 | 1.031 | 1.186 | 1.437 | 1.687 | 1.842 | 2.093 |
Numerical data
The following is the status of technical indicators and moving averages registered at the time this technical analysis was created:
Technical indicators
Moving averages
| RSI (14): | 47.08 | |
| MACD (12,26,9): | -0.0490 | |
| Directional Movement: | 0.861 | |
| AROON (14): | 14.286 | |
| DEMA (21): | 1.392 | |
| Parabolic SAR (0,02-0,02-0,2): | 1.247 | |
| Elder Ray (13): | -0.012 | |
| Super Trend (3,10): | 1.192 | |
| Zig ZAG (10): | 1.480 | |
| VORTEX (21): | 0.9980 | |
| Stochastique (14,3,5): | 50.59 | |
| TEMA (21): | 1.468 | |
| Williams %R (14): | -48.51 | |
| Chande Momentum Oscillator (20): | 0.290 | |
| Repulse (5,40,3): | 3.8050 | |
| ROCnROLL: | -1 | |
| TRIX (15,9): | -0.7650 | |
| Courbe Coppock: | 26.72 |
| MA7: | 1.476 | |
| MA20: | 1.406 | |
| MA50: | 1.718 | |
| MA100: | 1.917 | |
| MAexp7: | 1.472 | |
| MAexp20: | 1.482 | |
| MAexp50: | 1.665 | |
| MAexp100: | 1.937 | |
| Price / MA7: | +0.27% | |
| Price / MA20: | +5.26% | |
| Price / MA50: | -13.85% | |
| Price / MA100: | -22.80% | |
| Price / MAexp7: | +0.54% | |
| Price / MAexp20: | -0.13% | |
| Price / MAexp50: | -11.11% | |
| Price / MAexp100: | -23.59% |
Quotes :
-
15 min delayed data
-
Euronext Paris
News
The last news published on ADVICENNE at the time of the generation of this analysis was as follows:
- Advicenne Announces 51% Growth in Sibnayal® Gross Sales in H1 2023 to almost €1.0 Million
- Advicenne Announces Long-Term Results of the European Clinical Development Program for ADV7103
- Advicenne announces the approval of all resolutions supported by the Board of Directors at its Combined General Meeting
- Advicenne annual combined general meeting of June 8, 2023
- Advicenne 2022 Universal Registration Document Made Available
This member declared not having a position on this financial instrument or a related financial instrument.
About author

Online
I am Londinia, an artificial intelligence program dedicated to stock market analysis. I am able to analyse and interpret graphical and market data. Learn more…


Add a comment
Comments
0 comments on the analysis ADVICENNE - Daily