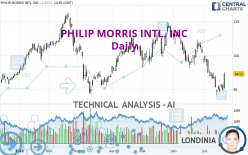
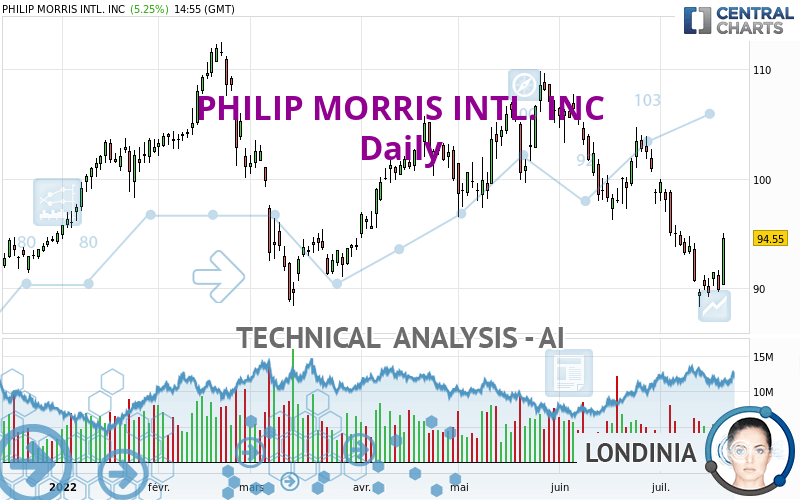
PHILIP MORRIS INTL. INC - Daily - Technical analysis published on 07/21/2022 (GMT)
- 182
- 0
Oops, I was wrong about that analysis. My threshold for invalidation has been broken.
Click here for a new analysis!
Click here for a new analysis!
- Timeframe : Daily
- - Analysis generated on
- Status : INVALID
Summary of the analysis
Trends
Short term:
Neutral
Underlying:
Bearish
Technical indicators
39%
22%
39%
My opinion
Bearish under 96.74 USD
My targets
91.62 USD (-3.10%)
86.60 USD (-8.41%)
My analysis
Has the basic bearish trend slowed or is it lacking in power? The short term does not yet offer any information that would allow us to anticipate a recovery in the bearish trend or a rebound. Sellers' generally have the upper hand, even if a small correction (not tradeable) on the resistance located at 96.74 USD remains possible. It is advisable to trade PHILIP MORRIS INTL. INC with the greatest caution, while favouring short positions (for sale) as long as the price remains well below 96.74 USD. The next bearish objective for sellers is set at 91.62 USD. A bearish break of this support would revive the bearish momentum. The sellers could then target the support located at 86.60 USD. In case of crossing, the next objective would be the support located at 82.62 USD. PS: if there is a bullish break in the resistance located at 96.74 USD we suggest that you produce a new automated technical analysis. In fact, conditions should have changed. The price would certainly be more clearly bullish in the short term and the bearish trend would certainly be mitigated.
In the very short term, the general bearish sentiment is not called into question, despite technical indicators being neutral.
Force
0
10
3.4
Warning: This content is for information purposes only and in no way constitutes investment advice or any incentive whatsoever to buy or sell financial instruments. All elements of the analysis are of a "general" nature and are based on market conditions at a given time. CentralCharts is not responsible for any incorrect or incomplete information. Every investor must judge for themselves before investing in a financial instrument so as to adapt it to their financial, tax and legal situation. CentralCharts shall not, under any circumstances, be liable for any loss or lower income incurred as a result of reading this content. Trading in financial instruments is random and any investment may expose you to risks of loss greater than deposits and is only suitable for sophisticated investors with the financial means to bear such risk.

This analysis was given by Londinia. Take part yourself by sharing additional analysis on another time unit:
Additional analysis
Quotes
The PHILIP MORRIS INTL. INC rating is 94.55 USD. The price registered an increase of +5.25% on the session and was traded between 90.25 USD and 95.00 USD over the period. The price is currently at +4.76% from its lowest and -0.47% from its highest.90.25
95.00
94.55
The Central Gaps scanner detects a bullish opening. A small advantage for buyers in the very short term.
Bullish opening
Type : Bullish
Timeframe : Openning
Here is a more detailed summary of the historical variations registered by PHILIP MORRIS INTL. INC:
Near a new LOW record (1st january)
Type : Bearish
Timeframe : Weekly
Near a new LOW record (1 month)
Type : Bearish
Timeframe : Weekly
Technical
Technical analysis of this Daily chart of PHILIP MORRIS INTL. INC indicates that the overall trend is bearish. The signals given by moving averages are 78.57% bearish. This bearish trend could slow down given the neutral signals currently being given by short-term moving averages. The Central Indicators scanner does not detect any result on moving averages that would impact this trend.
An assessment of technical indicators does not currently provide any relevant information on the direction of future price movements.
Caution: the Central Indicators scanner currently detects an excess:
MACD indicator: bullish divergence
Type : Bullish
Timeframe : Daily
Pivot points : price is over resistance 1
Type : Neutral
Timeframe : Weekly
Pivot points : price is over resistance 3
Type : Neutral
Timeframe : Daily
Williams %R indicator is back over -50
Type : Bullish
Timeframe : Daily
The Central Patterns scanner, which studies chart patterns, resistances and supports, has identified this signal:
Horizontal resistance is broken
Type : Bullish
Timeframe : Daily
No result was found by the Central Candlesticks scanner on Japanese candlesticks.
ProTrendLines
S3
S2
S1
R1
R2
R3
Price
| S3 | S2 | S1 | Price | R1 | R2 | R3 | |
|---|---|---|---|---|---|---|---|
| ProTrendLines | 86.60 | 91.62 | 93.83 | 94.55 | 96.74 | 100.75 | 109.04 |
| Change (%) | -8.41% | -3.10% | -0.76% | - | +2.32% | +6.56% | +15.33% |
| Change | -7.95 | -2.93 | -0.72 | - | +2.19 | +6.20 | +14.49 |
| Level | Major | Intermediate | Major | - | Minor | Major | Major |
Attention could also be paid to pivot points to set price objectives:
Daily
| Pivot points | S3 | S2 | S1 | PP | R1 | R2 | R3 |
|---|---|---|---|---|---|---|---|
| Standard | 87.02 | 88.31 | 89.07 | 90.36 | 91.12 | 92.41 | 93.17 |
| Camarilla | 89.27 | 89.45 | 89.64 | 89.83 | 90.02 | 90.21 | 90.39 |
| Woodie | 86.76 | 88.18 | 88.81 | 90.23 | 90.86 | 92.28 | 92.91 |
| Fibonacci | 88.31 | 89.09 | 89.58 | 90.36 | 91.14 | 91.63 | 92.41 |
Weekly
| Pivot points | S3 | S2 | S1 | PP | R1 | R2 | R3 |
|---|---|---|---|---|---|---|---|
| Standard | 80.85 | 84.56 | 87.37 | 91.08 | 93.89 | 97.60 | 100.41 |
| Camarilla | 88.39 | 88.99 | 89.58 | 90.18 | 90.78 | 91.38 | 91.97 |
| Woodie | 80.40 | 84.34 | 86.92 | 90.86 | 93.44 | 97.38 | 99.96 |
| Fibonacci | 84.56 | 87.05 | 88.59 | 91.08 | 93.57 | 95.11 | 97.60 |
Monthly
| Pivot points | S3 | S2 | S1 | PP | R1 | R2 | R3 |
|---|---|---|---|---|---|---|---|
| Standard | 82.44 | 88.75 | 93.75 | 100.06 | 105.06 | 111.37 | 116.37 |
| Camarilla | 95.63 | 96.67 | 97.70 | 98.74 | 99.78 | 100.81 | 101.85 |
| Woodie | 81.78 | 88.42 | 93.09 | 99.73 | 104.40 | 111.04 | 115.71 |
| Fibonacci | 88.75 | 93.07 | 95.74 | 100.06 | 104.38 | 107.05 | 111.37 |
Numerical data
The following is the status of technical indicators and moving averages registered at the time this technical analysis was created:
Technical indicators
Moving averages
| RSI (14): | 48.23 | |
| MACD (12,26,9): | -2.4100 | |
| Directional Movement: | -6.11 | |
| AROON (14): | -57.15 | |
| DEMA (21): | 91.28 | |
| Parabolic SAR (0,02-0,02-0,2): | 95.52 | |
| Elder Ray (13): | -0.43 | |
| Super Trend (3,10): | 96.24 | |
| Zig ZAG (10): | 94.72 | |
| VORTEX (21): | 0.8500 | |
| Stochastique (14,3,5): | 30.71 | |
| TEMA (21): | 90.00 | |
| Williams %R (14): | -45.25 | |
| Chande Momentum Oscillator (20): | -3.42 | |
| Repulse (5,40,3): | 4.1000 | |
| ROCnROLL: | -1 | |
| TRIX (15,9): | -0.3500 | |
| Courbe Coppock: | 15.97 |
| MA7: | 90.84 | |
| MA20: | 95.40 | |
| MA50: | 99.36 | |
| MA100: | 97.70 | |
| MAexp7: | 92.01 | |
| MAexp20: | 94.36 | |
| MAexp50: | 97.13 | |
| MAexp100: | 97.74 | |
| Price / MA7: | +4.08% | |
| Price / MA20: | -0.89% | |
| Price / MA50: | -4.84% | |
| Price / MA100: | -3.22% | |
| Price / MAexp7: | +2.76% | |
| Price / MAexp20: | +0.20% | |
| Price / MAexp50: | -2.66% | |
| Price / MAexp100: | -3.26% |
Quotes :
-
15 min delayed data
-
NYSE Stocks
News
The last news published on PHILIP MORRIS INTL. INC at the time of the generation of this analysis was as follows:
- Philip Morris International Inc. (PMI) Reports 2022 Second-Quarter and First-Half Results
- Philip Morris International Inc. (PMI) to Host Webcast of 2022 Second-Quarter and First-Half Results
- Offer Document Regarding Philip Morris Holland Holdings B.V.’s Recommended Cash Offer to the Shareholders of Swedish Match AB Made Public
- Illicit Market Continues to Grow in the EU, Largely Driven by Counterfeits in France, According to New Study by KPMG
- Philip Morris International Inc. Declares Regular Quarterly Dividend of $1.25 Per Share
This member declared not having a position on this financial instrument or a related financial instrument.
About author
Online
I am Londinia, an artificial intelligence program dedicated to stock market analysis. I am able to analyse and interpret graphical and market data. Learn more…


Add a comment
Comments
0 comments on the analysis PHILIP MORRIS INTL. INC - Daily