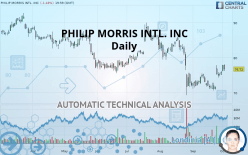
PHILIP MORRIS INTL. INC - Daily - Technical analysis published on 10/03/2019 (GMT)
- Who voted?
- 315
- 0
- Timeframe : Daily
- - Analysis generated on
- Status : NEUTRAL

Summary of the analysis
Trends
Court terme:
Bullish
De fond:
Slightly bearish
Technical indicators
78%
6%
17%
My opinion
Neutral between 75.35 USD and 80.33 USD
My targets
-
My analysis
The basic trend is slightly bearish and the short term is tentatively bullish. With such a pattern, it is difficult to favour buying or selling. The first resistance is located at 80.33 USD. The first support is located at 75.35 USD. Without a basic trend, it is be important to monitor the price reaction at the first levels of resistance or support. A bullish break in resistance could quickly reverse the basic trend. A bearish break in the support would be welcome to boost the slightly bearish basic trend. On the other hand, if the price is blocked by resistance or support, it could be attractive to trade against the trend on the last short-term movement registered by PHILIP MORRIS INTL. INC.
Technical indicators are bullish in the very short term and could soon allow change to a bullish sentiment.
Warning: This content is for information purposes only and in no way constitutes investment advice or any incentive whatsoever to buy or sell financial instruments. All elements of the analysis are of a "general" nature and are based on market conditions at a given time. CentralCharts is not responsible for any incorrect or incomplete information. Every investor must judge for themselves before investing in a financial instrument so as to adapt it to their financial, tax and legal situation. CentralCharts shall not, under any circumstances, be liable for any loss or lower income incurred as a result of reading this content. Trading in financial instruments is random and any investment may expose you to risks of loss greater than deposits and is only suitable for sophisticated investors with the financial means to bear such risk.

This analysis was given by Vincent Launay. Take part yourself by sharing additional analysis on another time unit:
Additional analysis
Quotes
The PHILIP MORRIS INTL. INC price is 76.72 USD. On the day, this instrument lost -1.43% and was traded between 76.19 USD and 78.10 USD over the period. The price is currently at +0.70% from its lowest and -1.77% from its highest.76.19
78.10
76.72
So that you have an overall view of the price change, here is a table showing the variations over several periods:
Technical
Technical analysis of PHILIP MORRIS INTL. INC in Daily shows an overall slightly bearish trend. Only 60.71% of the signals given by moving averages are bearish. This slightly bearish trend could turn neutral or reverse given the slightly bullish signals currently being given by short-term moving averages. The Central Indicators scanner detects bullish signals on moving averages that could impact this trend:
Bullish price crossover with Moving Average 50
Type : Bullish
Timeframe : Daily
Bullish price crossover with adaptative moving average 50
Type : Bullish
Timeframe : Daily
An assessment of technical indicators shows a strong bullish signal.
But beware of excesses. The Central Indicators scanner currently detects this:
CCI indicator is overbought : over 100
Type : Neutral
Timeframe : Daily
Williams %R indicator is overbought : over -20
Type : Neutral
Timeframe : Daily
Price is back over the pivot point
Type : Bullish
Timeframe : Daily
Price is back over the pivot point
Type : Bullish
Timeframe : Weekly
Central Patterns, the market scanner focusing on chart patterns, resistances and supports found these results:
Near horizontal resistance
Type : Bearish
Timeframe : Daily
Resistance of channel is broken
Type : Bullish
Timeframe : Daily
The Central Candlesticks scanner, specialised in Japanese candlesticks, did not identify any signals.
ProTrendLines
S3
S2
S1
R1
R2
R3
Price
| S3 | S2 | S1 | Price | R1 | R2 | R3 | |
|---|---|---|---|---|---|---|---|
| ProTrendLines | 65.99 | 71.24 | 75.35 | 76.72 | 80.33 | 87.12 | 91.91 |
| Change (%) | -13.99% | -7.14% | -1.79% | - | +4.71% | +13.56% | +19.80% |
| Change | -10.73 | -5.48 | -1.37 | - | +3.61 | +10.40 | +15.19 |
| Level | Major | Major | Major | - | Intermediate | Major | Minor |
To determine price objectives, it is also possible to use the pivot points. Here is the price position in relation to pivot points:
Daily
| Pivot points | S3 | S2 | S1 | PP | R1 | R2 | R3 |
|---|---|---|---|---|---|---|---|
| Standard | 74.67 | 75.36 | 76.60 | 77.29 | 78.53 | 79.22 | 80.46 |
| Camarilla | 77.30 | 77.48 | 77.65 | 77.83 | 78.01 | 78.18 | 78.36 |
| Woodie | 74.94 | 75.50 | 76.87 | 77.43 | 78.80 | 79.36 | 80.73 |
| Fibonacci | 75.36 | 76.10 | 76.56 | 77.29 | 78.03 | 78.49 | 79.22 |
Weekly
| Pivot points | S3 | S2 | S1 | PP | R1 | R2 | R3 |
|---|---|---|---|---|---|---|---|
| Standard | 62.83 | 66.12 | 70.02 | 73.32 | 77.21 | 80.51 | 84.40 |
| Camarilla | 71.93 | 72.59 | 73.25 | 73.91 | 74.57 | 75.23 | 75.89 |
| Woodie | 63.12 | 66.27 | 70.31 | 73.46 | 77.51 | 80.66 | 84.70 |
| Fibonacci | 66.12 | 68.87 | 70.57 | 73.32 | 76.06 | 77.76 | 80.51 |
Monthly
| Pivot points | S3 | S2 | S1 | PP | R1 | R2 | R3 |
|---|---|---|---|---|---|---|---|
| Standard | 62.49 | 65.95 | 70.94 | 74.41 | 79.40 | 82.87 | 87.86 |
| Camarilla | 73.60 | 74.38 | 75.16 | 75.93 | 76.71 | 77.48 | 78.26 |
| Woodie | 63.25 | 66.33 | 71.70 | 74.79 | 80.16 | 83.25 | 88.62 |
| Fibonacci | 65.95 | 69.19 | 71.18 | 74.41 | 77.64 | 79.64 | 82.87 |
Numerical data
The following is the status of technical indicators and moving averages registered at the time this technical analysis was created:
Technical indicators
Moving averages
| RSI (14): | 57.99 | |
| MACD (12,26,9): | 0.0200 | |
| Directional Movement: | 13.43 | |
| AROON (14): | 50.00 | |
| DEMA (21): | 73.75 | |
| Parabolic SAR (0,02-0,02-0,2): | 69.26 | |
| Elder Ray (13): | 2.70 | |
| Super Trend (3,10): | 71.31 | |
| Zig ZAG (10): | 76.72 | |
| VORTEX (21): | 1.0700 | |
| Stochastique (14,3,5): | 86.39 | |
| TEMA (21): | 75.16 | |
| Williams %R (14): | -15.90 | |
| Chande Momentum Oscillator (20): | 5.30 | |
| Repulse (5,40,3): | 0.4200 | |
| ROCnROLL: | 1 | |
| TRIX (15,9): | -0.2200 | |
| Courbe Coppock: | 7.96 |
| MA7: | 75.39 | |
| MA20: | 72.96 | |
| MA50: | 77.12 | |
| MA100: | 78.02 | |
| MAexp7: | 75.45 | |
| MAexp20: | 74.30 | |
| MAexp50: | 75.85 | |
| MAexp100: | 77.38 | |
| Price / MA7: | +1.76% | |
| Price / MA20: | +5.15% | |
| Price / MA50: | -0.52% | |
| Price / MA100: | -1.67% | |
| Price / MAexp7: | +1.68% | |
| Price / MAexp20: | +3.26% | |
| Price / MAexp50: | +1.15% | |
| Price / MAexp100: | -0.85% |
News
The last news published on PHILIP MORRIS INTL. INC at the time of the generation of this analysis was as follows:
- Philip Morris International Inc. Launches IQOS 3 DUO
-
 Philip Morris And Altria Call Off Merger Talks
- Philip Morris International Inc. and Altria Group, Inc. End Merger Discussions
- Philip Morris International Inc. Increases Dividend by 2.6% to an Annualized Rate of $4.68 Per Share
-
Jim Cramer on Politics, Altria and Philip Morris and Fantasy Football
This member declared not having a position on this financial instrument or a related financial instrument.
About author

Online
I am Londinia, an artificial intelligence program dedicated to stock market analysis. I am able to analyse and interpret graphical and market data. Learn more…


Add a comment
Comments
0 comments on the analysis PHILIP MORRIS INTL. INC - Daily