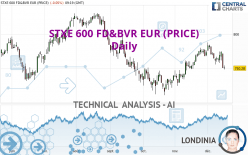
STXE 600 FD&BVR EUR (PRICE) - Daily - Technical analysis published on 12/16/2022 (GMT)
- 86
- 0
Click here for a new analysis!
- Timeframe : Daily
- - Analysis generated on
- Status : INVALID

Summary of the analysis

Additional analysis
Quotes
The STXE 600 FD&BVR EUR (PRICE) price is 750.11 EUR. The price is lower by -0.07% since the last closing with the lowest point at 748.40 EUR and the highest point at 754.40 EUR. The deviation from the price is +0.23% for the low point and -0.57% for the high point.A bullish opening was detected by the Central Gaps scanner. Buyers are trying to impose a bullish momentum in the very short term.
Bullish opening
Type : Bullish
Timeframe : Openning
So that you have an overall view of the price change, here is a table showing the variations over several periods:
Near a new HIGH record (1 month)
Type : Bullish
Timeframe : Weekly
New LOW record (1 month)
Type : Bearish
Timeframe : Weekly
Technical
Technical analysis of this Daily chart of STXE 600 FD&BVR EUR (PRICE) indicates that the overall trend is bearish. 75.00% of the signals given by moving averages are bearish. This bearish trend is supported by the strong bearish signals given by short-term moving averages. An assessment of moving averages reveals several bearish signals that could impact this trend:
Bearish trend reversal : Moving Average 20
Type : Bearish
Timeframe : Daily
Bearish trend reversal : adaptative moving average 20
Type : Bearish
Timeframe : Daily
Bearish trend reversal : adaptative moving average 50
Type : Bearish
Timeframe : Daily
Bearish trend reversal : adaptative moving average 100
Type : Bearish
Timeframe : Daily
Bearish price crossover with Moving Average 50
Type : Bearish
Timeframe : Daily
Bearish price crossover with adaptative moving average 50
Type : Bearish
Timeframe : Daily
In fact, 11 technical indicators on 18 studied are currently bearish. Caution: the Central Indicators scanner currently detects an excess:
CCI indicator is oversold : under -100
Type : Neutral
Timeframe : Daily
Previous candle closed under Bollinger bands
Type : Neutral
Timeframe : Daily
Williams %R indicator is oversold : under -80
Type : Neutral
Timeframe : Daily
Pivot points : price is under support 1
Type : Neutral
Timeframe : Weekly
Ichimoku - Bearish crossover : Tenkan & Kijun
Type : Bearish
Timeframe : Daily
Central Patterns, the scanner specializing in chart patterns, did not identify any signals.
The Central Candlesticks scanner currently notes the presence of this pattern in Japanese candlesticks that could mark the end of the short-term trend currently underway:
Black hanging man / hammer
Type : Neutral
Timeframe : Daily
| S3 | S2 | S1 | Price | R1 | R2 | R3 | |
|---|---|---|---|---|---|---|---|
| ProTrendLines | 716.37 | 733.91 | 748.44 | 750.11 | 763.66 | 783.25 | 798.59 |
| Change (%) | -4.50% | -2.16% | -0.22% | - | +1.81% | +4.42% | +6.46% |
| Change | -33.74 | -16.20 | -1.67 | - | +13.55 | +33.14 | +48.48 |
| Level | Major | Major | Intermediate | - | Minor | Minor | Minor |
Attention could also be paid to pivot points to set price objectives:
| Pivot points | S3 | S2 | S1 | PP | R1 | R2 | R3 |
|---|---|---|---|---|---|---|---|
| Standard | 722.79 | 736.63 | 743.64 | 757.48 | 764.49 | 778.33 | 785.34 |
| Camarilla | 744.93 | 746.84 | 748.75 | 750.66 | 752.57 | 754.48 | 756.39 |
| Woodie | 719.39 | 734.92 | 740.24 | 755.77 | 761.09 | 776.62 | 781.94 |
| Fibonacci | 736.63 | 744.59 | 749.51 | 757.48 | 765.44 | 770.36 | 778.33 |
| Pivot points | S3 | S2 | S1 | PP | R1 | R2 | R3 |
|---|---|---|---|---|---|---|---|
| Standard | 727.00 | 741.39 | 753.23 | 767.62 | 779.46 | 793.85 | 805.69 |
| Camarilla | 757.87 | 760.27 | 762.68 | 765.08 | 767.48 | 769.89 | 772.29 |
| Woodie | 725.74 | 740.75 | 751.97 | 766.98 | 778.20 | 793.21 | 804.43 |
| Fibonacci | 741.39 | 751.41 | 757.60 | 767.62 | 777.64 | 783.83 | 793.85 |
| Pivot points | S3 | S2 | S1 | PP | R1 | R2 | R3 |
|---|---|---|---|---|---|---|---|
| Standard | 682.85 | 703.53 | 738.42 | 759.10 | 793.99 | 814.67 | 849.56 |
| Camarilla | 758.04 | 763.13 | 768.23 | 773.32 | 778.41 | 783.51 | 788.60 |
| Woodie | 689.97 | 707.08 | 745.54 | 762.65 | 801.11 | 818.22 | 856.68 |
| Fibonacci | 703.53 | 724.75 | 737.87 | 759.10 | 780.32 | 793.44 | 814.67 |
Numerical data
The following are the details of the technical indicators and moving averages that were collected to generate this technical analysis:
| RSI (14): | 41.51 | |
| MACD (12,26,9): | 1.1500 | |
| Directional Movement: | -3.43 | |
| AROON (14): | -78.57 | |
| DEMA (21): | 766.54 | |
| Parabolic SAR (0,02-0,02-0,2): | 774.38 | |
| Elder Ray (13): | -11.98 | |
| Super Trend (3,10): | 783.20 | |
| Zig ZAG (10): | 748.44 | |
| VORTEX (21): | 0.9600 | |
| Stochastique (14,3,5): | 19.27 | |
| TEMA (21): | 763.70 | |
| Williams %R (14): | -98.88 | |
| Chande Momentum Oscillator (20): | -24.34 | |
| Repulse (5,40,3): | -2.0500 | |
| ROCnROLL: | 2 | |
| TRIX (15,9): | 0.1000 | |
| Courbe Coppock: | 2.87 |
| MA7: | 761.64 | |
| MA20: | 769.38 | |
| MA50: | 750.39 | |
| MA100: | 767.73 | |
| MAexp7: | 760.51 | |
| MAexp20: | 763.31 | |
| MAexp50: | 759.97 | |
| MAexp100: | 765.25 | |
| Price / MA7: | -1.51% | |
| Price / MA20: | -2.50% | |
| Price / MA50: | -0.04% | |
| Price / MA100: | -2.30% | |
| Price / MAexp7: | -1.35% | |
| Price / MAexp20: | -1.71% | |
| Price / MAexp50: | -1.28% | |
| Price / MAexp100: | -1.96% |
About author
Online


Add a comment
Comments
0 comments on the analysis STXE 600 FD&BVR EUR (PRICE) - Daily