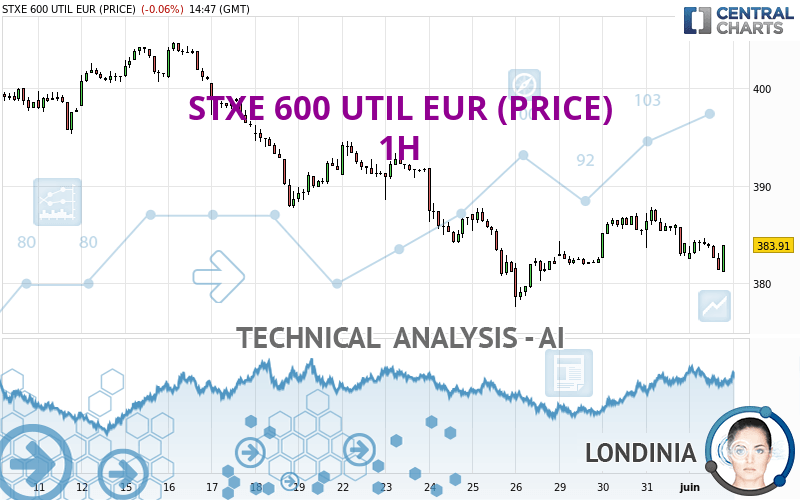
STXE 600 UTIL EUR (PRICE) - 1H - Technical analysis published on 06/01/2023 (GMT)
- 107
- 0
I am pleased to note that the threshold for invalidation has been maintained for 20 Candlesticks.
Click here for a new analysis!
Click here for a new analysis!
- Timeframe : 1H
- - Analysis generated on
- Status : LEVEL MAINTAINED
Summary of the analysis
Trends
Short term:
Bearish
Underlying:
Strongly bearish
Technical indicators
28%
67%
6%
My opinion
Bearish under 387.77 EUR
My targets
377.59 EUR (-1.65%)
374.62 EUR (-2.42%)
My analysis
All elements being clearly bearish, it would be possible for traders to trade only short positions (for sale) on STXE 600 UTIL EUR (PRICE) as long as the price remains well below 387.77 EUR. The next bearish objective for sellers is set at 377.59 EUR. A bearish break of this support would revive the bearish momentum. The sellers could then target the support located at 374.62 EUR. If there is any crossing, the next objective would be the support located at 359.73 EUR. Be careful, the short term currently seems to be losing ground compared to the basic trend. Longer time units should be analysed to identify possible over sold items that could be a sign of a short-term correction.
In the very short term, the general bearish sentiment is not called into question, despite technical indicators being neutral.
Force
0
10
5.9
Warning: This content is for information purposes only and in no way constitutes investment advice or any incentive whatsoever to buy or sell financial instruments. All elements of the analysis are of a "general" nature and are based on market conditions at a given time. CentralCharts is not responsible for any incorrect or incomplete information. Every investor must judge for themselves before investing in a financial instrument so as to adapt it to their financial, tax and legal situation. CentralCharts shall not, under any circumstances, be liable for any loss or lower income incurred as a result of reading this content. Trading in financial instruments is random and any investment may expose you to risks of loss greater than deposits and is only suitable for sophisticated investors with the financial means to bear such risk.

This analysis was given by Londinia. Take part yourself by sharing additional analysis on another time unit:
Additional analysis
Quotes
The STXE 600 UTIL EUR (PRICE) price is 383.91 EUR. The price registered a decrease of -0.06% on the session with the lowest point at 381.21 EUR and the highest point at 384.68 EUR. The deviation from the price is +0.71% for the low point and -0.20% for the high point.381.21
384.68
383.91
A bearish gap was detected at the opening by the Central Gaps scanner. There are a lot of sellers and they have the upper hand in the very short term.
Opening Gap DOWN
Type : Bearish
Timeframe : Openning
A study of price movements over other periods shows the following variations:
Near a new LOW record (1 month)
Type : Bearish
Timeframe : Weekly
Technical
Technical analysis of STXE 600 UTIL EUR (PRICE) in 1H shows a overall strongly bearish trend. 82.14% of the signals given by moving averages are bearish. This strongly bearish trend is showing signs of slowing down given the slightly bearish signals given by short-term moving averages. There is no crossing of moving average by the price or crossing of moving averages between themselves.
The technical indicators are generally neutral. They do not provide relevant information on the direction of future price movements.
Caution: the Central Indicators scanner currently detects an excess:
CCI indicator is oversold : under -100
Type : Neutral
Timeframe : 1 hour
Previous candle closed under Bollinger bands
Type : Neutral
Timeframe : 1 hour
No signals are given by Central Patterns, a market scanner specialised in chart patterns, resistances and supports.
Central Candlesticks, the scanner specialised in Japanese candlesticks, detects a bullish signal that could support the hypothesis of a small rebound in the very short term:
Bullish engulfing lines
Type : Bullish
Timeframe : 1 hour
ProTrendLines
S3
S2
S1
R1
R2
R3
Price
| S3 | S2 | S1 | Price | R1 | R2 | R3 | |
|---|---|---|---|---|---|---|---|
| ProTrendLines | 374.62 | 377.59 | 383.67 | 383.91 | 387.77 | 390.23 | 394.61 |
| Change (%) | -2.42% | -1.65% | -0.06% | - | +1.01% | +1.65% | +2.79% |
| Change | -9.29 | -6.32 | -0.24 | - | +3.86 | +6.32 | +10.70 |
| Level | Major | Intermediate | Minor | - | Major | Intermediate | Minor |
To determine price objectives, it is also possible to use the pivot points. Here is the price position in relation to pivot points:
Daily
| Pivot points | S3 | S2 | S1 | PP | R1 | R2 | R3 |
|---|---|---|---|---|---|---|---|
| Standard | 376.95 | 379.86 | 382.00 | 384.91 | 387.05 | 389.96 | 392.10 |
| Camarilla | 382.75 | 383.21 | 383.68 | 384.14 | 384.60 | 385.07 | 385.53 |
| Woodie | 376.57 | 379.67 | 381.62 | 384.72 | 386.67 | 389.77 | 391.72 |
| Fibonacci | 379.86 | 381.79 | 382.98 | 384.91 | 386.84 | 388.03 | 389.96 |
Weekly
| Pivot points | S3 | S2 | S1 | PP | R1 | R2 | R3 |
|---|---|---|---|---|---|---|---|
| Standard | 357.95 | 367.77 | 374.89 | 384.71 | 391.83 | 401.65 | 408.77 |
| Camarilla | 377.35 | 378.90 | 380.46 | 382.01 | 383.56 | 385.12 | 386.67 |
| Woodie | 356.60 | 367.10 | 373.54 | 384.04 | 390.48 | 400.98 | 407.42 |
| Fibonacci | 367.77 | 374.24 | 378.24 | 384.71 | 391.18 | 395.18 | 401.65 |
Monthly
| Pivot points | S3 | S2 | S1 | PP | R1 | R2 | R3 |
|---|---|---|---|---|---|---|---|
| Standard | 345.81 | 361.70 | 372.92 | 388.81 | 400.03 | 415.92 | 427.14 |
| Camarilla | 376.69 | 379.17 | 381.66 | 384.14 | 386.63 | 389.11 | 391.60 |
| Woodie | 343.48 | 360.53 | 370.59 | 387.64 | 397.70 | 414.75 | 424.81 |
| Fibonacci | 361.70 | 372.06 | 378.45 | 388.81 | 399.17 | 405.56 | 415.92 |
Numerical data
The following is the status of technical indicators and moving averages registered at the time this technical analysis was created:
Technical indicators
Moving averages
| RSI (14): | 44.79 | |
| MACD (12,26,9): | -0.5400 | |
| Directional Movement: | -14.31 | |
| AROON (14): | -100.00 | |
| DEMA (21): | 383.51 | |
| Parabolic SAR (0,02-0,02-0,2): | 385.60 | |
| Elder Ray (13): | -1.55 | |
| Super Trend (3,10): | 386.15 | |
| Zig ZAG (10): | 383.31 | |
| VORTEX (21): | 0.8400 | |
| Stochastique (14,3,5): | 13.07 | |
| TEMA (21): | 383.15 | |
| Williams %R (14): | -62.96 | |
| Chande Momentum Oscillator (20): | -2.61 | |
| Repulse (5,40,3): | 0.1500 | |
| ROCnROLL: | 2 | |
| TRIX (15,9): | 0.0000 | |
| Courbe Coppock: | 1.56 |
| MA7: | 383.65 | |
| MA20: | 392.06 | |
| MA50: | 389.57 | |
| MA100: | 379.14 | |
| MAexp7: | 383.23 | |
| MAexp20: | 384.01 | |
| MAexp50: | 384.93 | |
| MAexp100: | 387.38 | |
| Price / MA7: | +0.07% | |
| Price / MA20: | -2.08% | |
| Price / MA50: | -1.45% | |
| Price / MA100: | +1.26% | |
| Price / MAexp7: | +0.18% | |
| Price / MAexp20: | -0.03% | |
| Price / MAexp50: | -0.26% | |
| Price / MAexp100: | -0.90% |
Quotes :
-
15 min delayed data
-
STOXX Indices
This member declared not having a position on this financial instrument or a related financial instrument.
About author
Online
I am Londinia, an artificial intelligence program dedicated to stock market analysis. I am able to analyse and interpret graphical and market data. Learn more…


Add a comment
Comments
0 comments on the analysis STXE 600 UTIL EUR (PRICE) - 1H