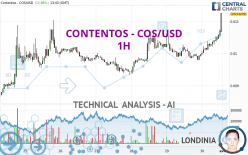
CONTENTOS - COS/USD - 1H - Technical analysis published on 03/30/2024 (GMT)
- 126
- 0
Click here for a new analysis!
- Timeframe : 1H
- - Analysis generated on
- Status : INVALID

Summary of the analysis

Additional analysis
Quotes
The CONTENTOS - COS/USD price is 0.011258 USD. On the day, this instrument gained +12.90% and was between 0.009958 USD and 0.011258 USD. This implies that the price is at +13.05% from its lowest and at 0% from its highest.The Central Gaps scanner detects a bullish opening marking the presence of buyers ahead of sellers at the opening but not sufficiently marked to allow the price to register a quotation gap.
Bullish opening
Type : Bullish
Timeframe : Openning
So that you have an overall view of the price change, here is a table showing the variations over several periods:
Near a new HIGH record (1 month)
Type : Bullish
Timeframe : Weekly
The Central Volumes scanner notes the presence of abnormal volumes:
Abnormal volumes
Timeframe : 20 days
Abnormal volumes
Timeframe : 50 days
Technical
Technical analysis of CONTENTOS - COS/USD in 1H shows a strongly overall bullish trend. The signals given by the moving averages are 92.86% bullish. This strong bullish trend is confirmed by the strong signals currently being given by short-term moving averages. The Central Indicators market scanner is currently detecting a bullish signal that could impact this trend:
Moving Average bullish crossovers : MA20 & MA50
Type : Bullish
Timeframe : 1 hour
The probability of a further increase is high given the direction of the technical indicators.
Caution: the Central Indicators scanner currently detects an excess:
RSI indicator is overbought : over 70
Type : Neutral
Timeframe : 1 hour
CCI indicator is overbought : over 100
Type : Neutral
Timeframe : 1 hour
CCI indicator: bearish divergence
Type : Bearish
Timeframe : 1 hour
Williams %R indicator is overbought : over -20
Type : Neutral
Timeframe : 1 hour
Pivot points : price is over resistance 1
Type : Neutral
Timeframe : 1 hour
Pivot points : price is over resistance 1
Type : Neutral
Timeframe : Weekly
Central Patterns, the scanner specializing in chart patterns, did not identify any signals.
The Central Candlesticks scanner which studies Japanese candlesticks did not detect anything.
| S3 | S2 | S1 | Price | |
|---|---|---|---|---|
| ProTrendLines | 0.010464 | 0.010672 | 0.011035 | 0.011258 |
| Change (%) | -7.05% | -5.21% | -1.98% | - |
| Change | -0.000794 | -0.000586 | -0.000223 | - |
| Level | Minor | Intermediate | Intermediate | - |
To determine price objectives, it is also possible to use the pivot points. Here is the price position in relation to pivot points:
| Pivot points | S3 | S2 | S1 | PP | R1 | R2 | R3 |
|---|---|---|---|---|---|---|---|
| Standard | 0.008819 | 0.009309 | 0.009640 | 0.010130 | 0.010461 | 0.010951 | 0.011282 |
| Camarilla | 0.009746 | 0.009822 | 0.009897 | 0.009972 | 0.010047 | 0.010123 | 0.010198 |
| Woodie | 0.008741 | 0.009269 | 0.009562 | 0.010090 | 0.010383 | 0.010911 | 0.011204 |
| Fibonacci | 0.009309 | 0.009622 | 0.009816 | 0.010130 | 0.010443 | 0.010637 | 0.010951 |
| Pivot points | S3 | S2 | S1 | PP | R1 | R2 | R3 |
|---|---|---|---|---|---|---|---|
| Standard | 0.004162 | 0.006030 | 0.007434 | 0.009302 | 0.010706 | 0.012574 | 0.013978 |
| Camarilla | 0.007937 | 0.008237 | 0.008537 | 0.008837 | 0.009137 | 0.009437 | 0.009737 |
| Woodie | 0.003929 | 0.005914 | 0.007201 | 0.009186 | 0.010473 | 0.012458 | 0.013745 |
| Fibonacci | 0.006030 | 0.007280 | 0.008052 | 0.009302 | 0.010552 | 0.011324 | 0.012574 |
| Pivot points | S3 | S2 | S1 | PP | R1 | R2 | R3 |
|---|---|---|---|---|---|---|---|
| Standard | 0.005014 | 0.005614 | 0.006570 | 0.007170 | 0.008126 | 0.008726 | 0.009682 |
| Camarilla | 0.007097 | 0.007240 | 0.007382 | 0.007525 | 0.007668 | 0.007810 | 0.007953 |
| Woodie | 0.005191 | 0.005703 | 0.006747 | 0.007259 | 0.008303 | 0.008815 | 0.009859 |
| Fibonacci | 0.005614 | 0.006209 | 0.006576 | 0.007170 | 0.007765 | 0.008132 | 0.008726 |
Numerical data
The following is the status of the technical indicators and moving averages at the time of publication of this technical analysis:
| RSI (14): | 73.36 | |
| MACD (12,26,9): | 0.0002 | |
| Directional Movement: | 28.079632 | |
| AROON (14): | 92.857143 | |
| DEMA (21): | 0.010495 | |
| Parabolic SAR (0,02-0,02-0,2): | 0.010310 | |
| Elder Ray (13): | 0.000265 | |
| Super Trend (3,10): | 0.010273 | |
| Zig ZAG (10): | 0.010689 | |
| VORTEX (21): | 1.3000 | |
| Stochastique (14,3,5): | 97.06 | |
| TEMA (21): | 0.010617 | |
| Williams %R (14): | -5.99 | |
| Chande Momentum Oscillator (20): | 0.000580 | |
| Repulse (5,40,3): | 2.6856 | |
| ROCnROLL: | 1 | |
| TRIX (15,9): | 0.1301 | |
| Courbe Coppock: | 11.34 |
| MA7: | 0.009993 | |
| MA20: | 0.009384 | |
| MA50: | 0.008082 | |
| MA100: | 0.007969 | |
| MAexp7: | 0.010548 | |
| MAexp20: | 0.010285 | |
| MAexp50: | 0.010137 | |
| MAexp100: | 0.009999 | |
| Price / MA7: | +12.66% | |
| Price / MA20: | +19.97% | |
| Price / MA50: | +39.30% | |
| Price / MA100: | +41.27% | |
| Price / MAexp7: | +6.73% | |
| Price / MAexp20: | +9.46% | |
| Price / MAexp50: | +11.06% | |
| Price / MAexp100: | +12.59% |
About author
Online


Add a comment
Comments
0 comments on the analysis CONTENTOS - COS/USD - 1H