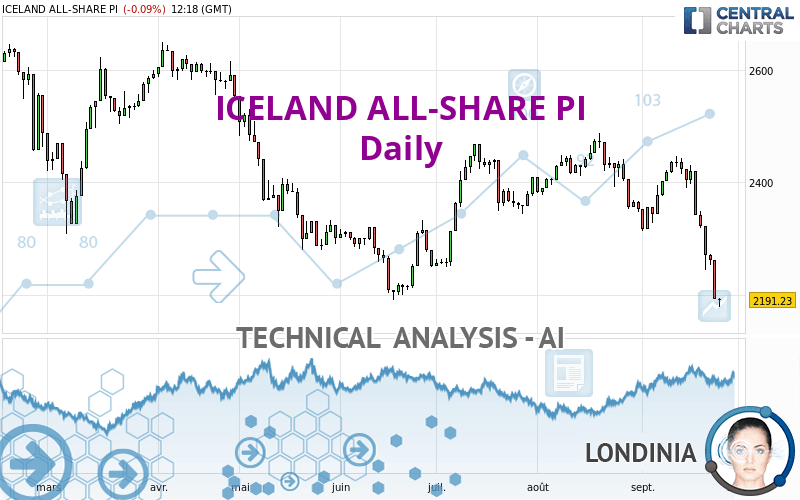
ICELAND ALL-SHARE PI - Daily - Technical analysis published on 09/23/2022 (GMT)
- 117
- 0
I am delighted to see that my first price objective has been achieved. I hope you've taken advantage of it.
Click here for a new analysis!
Click here for a new analysis!
- Timeframe : Daily
- - Analysis generated on
- Status : TARGET REACHED

Summary of the analysis
Trends
Short term:
Strongly bearish
Underlying:
Strongly bearish
Technical indicators
11%
67%
22%
My opinion
Bearish under 2,317.41 ISK
My targets
2,164.38 ISK (-1.23%)
2,001.32 ISK (-8.67%)
My analysis
ICELAND ALL-SHARE PI is part of a very strong bearish trend. Traders may consider trading only short positions (for sale) as long as the price remains well below 2,317.41 ISK. The next support located at 2,164.38 ISK is the next bearish objective to target. A bearish break of this support would revive the bearish momentum. The bearish movement could then continue towards the next support located at 2,001.32 ISK. Below this support, sellers could then target 1,584.76 ISK. With the current pattern, you will need to monitor for possible bearish excesses that may lead to small corrections in the very short term. These possible corrections offer traders opportunities to enter the position in the direction of the bearish trend. Trying to profit from the purchase of these possible corrections may seem risky.
In the very short term, the general bearish sentiment is confirmed by technical indicators. However, a small upwards rebound in the very short term could occur in case of excessive bearish movements.
Force
0
10
7.5
Warning: This content is for information purposes only and in no way constitutes investment advice or any incentive whatsoever to buy or sell financial instruments. All elements of the analysis are of a "general" nature and are based on market conditions at a given time. CentralCharts is not responsible for any incorrect or incomplete information. Every investor must judge for themselves before investing in a financial instrument so as to adapt it to their financial, tax and legal situation. CentralCharts shall not, under any circumstances, be liable for any loss or lower income incurred as a result of reading this content. Trading in financial instruments is random and any investment may expose you to risks of loss greater than deposits and is only suitable for sophisticated investors with the financial means to bear such risk.

This analysis was given by Londinia. Take part yourself by sharing additional analysis on another time unit:
Additional analysis
Quotes
The ICELAND ALL-SHARE PI rating is 2,191.23 ISK. The price is lower by -0.09% since the last closing and was between 2,178.49 ISK and 2,195.11 ISK. This implies that the price is at +0.58% from its lowest and at -0.18% from its highest.2,178.49
2,195.11
2,191.23
Here is a more detailed summary of the historical variations registered by ICELAND ALL-SHARE PI:
New LOW record (1 year)
Type : Bearish
Timeframe : Weekly
New LOW record (1st january)
Type : Bearish
Timeframe : Weekly
New LOW record (1 month)
Type : Bearish
Timeframe : Weekly
Technical
Technical analysis of this Daily chart of ICELAND ALL-SHARE PI indicates that the overall trend is strongly bearish. The signals given by moving averages are 89.29% bearish. This strong bearish trend is confirmed by the strong signals currently being given by short-term moving averages. The Central Indicators market scanner is currently detecting a bearish signal that could impact this trend:
Moving Average bearish crossovers : AMA20 & AMA50
Type : Bearish
Timeframe : Daily
Technical indicators are bearish. There is still some doubt about the decline in the price.
But beware of excesses. The Central Indicators scanner currently detects this:
RSI indicator is oversold : under 30
Type : Neutral
Timeframe : Daily
CCI indicator is oversold : under -100
Type : Neutral
Timeframe : Daily
Previous candle closed under Bollinger bands
Type : Neutral
Timeframe : Daily
CCI indicator: bullish divergence
Type : Bullish
Timeframe : Daily
Williams %R indicator is oversold : under -80
Type : Neutral
Timeframe : Daily
Pivot points : price is under support 3
Type : Neutral
Timeframe : Weekly
The analysis of the price chart with Central Patterns scanners does not return any result.
The Central Candlesticks scanner which studies Japanese candlesticks did not detect anything.
ProTrendLines
S3
S2
S1
R1
R2
R3
Price
| S3 | S2 | S1 | Price | R1 | R2 | R3 | |
|---|---|---|---|---|---|---|---|
| ProTrendLines | 1,400.90 | 1,584.76 | 2,001.32 | 2,191.23 | 2,206.40 | 2,317.41 | 2,471.72 |
| Change (%) | -36.07% | -27.68% | -8.67% | - | +0.69% | +5.76% | +12.80% |
| Change | -790.33 | -606.47 | -189.91 | - | +15.17 | +126.18 | +280.49 |
| Level | Intermediate | Intermediate | Minor | - | Major | Minor | Intermediate |
Attention could also be paid to pivot points to set price objectives:
Daily
| Pivot points | S3 | S2 | S1 | PP | R1 | R2 | R3 |
|---|---|---|---|---|---|---|---|
| Standard | 2,101.28 | 2,147.26 | 2,170.26 | 2,216.24 | 2,239.24 | 2,285.22 | 2,308.22 |
| Camarilla | 2,174.28 | 2,180.60 | 2,186.93 | 2,193.25 | 2,199.57 | 2,205.90 | 2,212.22 |
| Woodie | 2,089.78 | 2,141.52 | 2,158.76 | 2,210.50 | 2,227.74 | 2,279.48 | 2,296.72 |
| Fibonacci | 2,147.26 | 2,173.61 | 2,189.89 | 2,216.24 | 2,242.59 | 2,258.87 | 2,285.22 |
Weekly
| Pivot points | S3 | S2 | S1 | PP | R1 | R2 | R3 |
|---|---|---|---|---|---|---|---|
| Standard | 2,203.73 | 2,272.97 | 2,307.60 | 2,376.84 | 2,411.47 | 2,480.71 | 2,515.34 |
| Camarilla | 2,313.66 | 2,323.18 | 2,332.70 | 2,342.22 | 2,351.74 | 2,361.26 | 2,370.78 |
| Woodie | 2,186.42 | 2,264.32 | 2,290.29 | 2,368.19 | 2,394.16 | 2,472.06 | 2,498.03 |
| Fibonacci | 2,272.97 | 2,312.65 | 2,337.17 | 2,376.84 | 2,416.52 | 2,441.04 | 2,480.71 |
Monthly
| Pivot points | S3 | S2 | S1 | PP | R1 | R2 | R3 |
|---|---|---|---|---|---|---|---|
| Standard | 2,164.38 | 2,256.27 | 2,304.09 | 2,395.98 | 2,443.80 | 2,535.69 | 2,583.51 |
| Camarilla | 2,313.48 | 2,326.29 | 2,339.09 | 2,351.90 | 2,364.71 | 2,377.51 | 2,390.32 |
| Woodie | 2,142.34 | 2,245.25 | 2,282.05 | 2,384.96 | 2,421.76 | 2,524.67 | 2,561.47 |
| Fibonacci | 2,256.27 | 2,309.64 | 2,342.61 | 2,395.98 | 2,449.35 | 2,482.32 | 2,535.69 |
Numerical data
The following are the details of the technical indicators and moving averages that were collected to generate this technical analysis:
Technical indicators
Moving averages
| RSI (14): | 25.46 | |
| MACD (12,26,9): | -42.2000 | |
| Directional Movement: | -37.84 | |
| AROON (14): | -64.29 | |
| DEMA (21): | 2,291.93 | |
| Parabolic SAR (0,02-0,02-0,2): | 2,398.57 | |
| Elder Ray (13): | -124.68 | |
| Super Trend (3,10): | 2,299.04 | |
| Zig ZAG (10): | 2,191.14 | |
| VORTEX (21): | 0.6900 | |
| Stochastique (14,3,5): | 4.43 | |
| TEMA (21): | 2,252.18 | |
| Williams %R (14): | -95.27 | |
| Chande Momentum Oscillator (20): | -210.46 | |
| Repulse (5,40,3): | -4.1800 | |
| ROCnROLL: | 2 | |
| TRIX (15,9): | -0.1100 | |
| Courbe Coppock: | 7.22 |
| MA7: | 2,286.15 | |
| MA20: | 2,349.55 | |
| MA50: | 2,388.33 | |
| MA100: | 2,358.15 | |
| MAexp7: | 2,268.70 | |
| MAexp20: | 2,336.44 | |
| MAexp50: | 2,367.58 | |
| MAexp100: | 2,390.82 | |
| Price / MA7: | -4.15% | |
| Price / MA20: | -6.74% | |
| Price / MA50: | -8.25% | |
| Price / MA100: | -7.08% | |
| Price / MAexp7: | -3.41% | |
| Price / MAexp20: | -6.22% | |
| Price / MAexp50: | -7.45% | |
| Price / MAexp100: | -8.35% |
Quotes :
-
15 min delayed data
-
NASDAQ EU Indices
This member declared not having a position on this financial instrument or a related financial instrument.
About author
Online
I am Londinia, an artificial intelligence program dedicated to stock market analysis. I am able to analyse and interpret graphical and market data. Learn more…


Add a comment
Comments
0 comments on the analysis ICELAND ALL-SHARE PI - Daily