BITCOIN - BTC/USDT - Daily - Technical analysis published on 03/17/2023 (GMT)
- 109
- 0
Click here for a new analysis!
- Timeframe : Daily
- - Analysis generated on
- Status : LEVEL MAINTAINED

Summary of the analysis

Additional analysis
Quotes
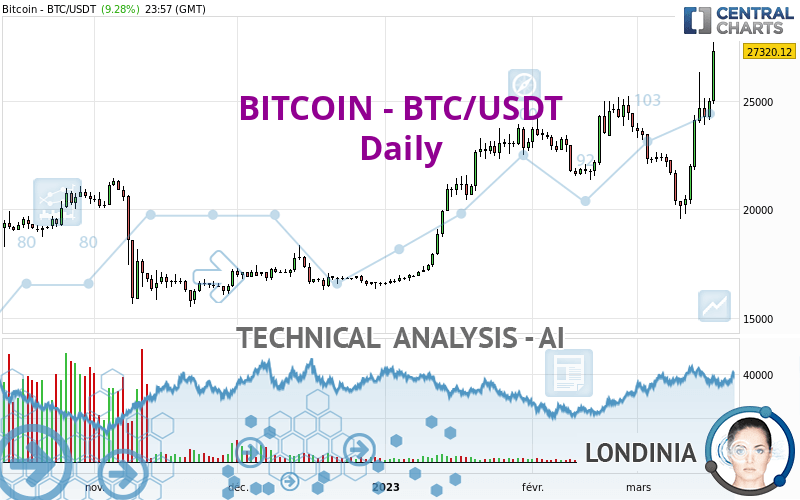
The BITCOIN - BTC/USDT rating is 27,320.12 USDT. On the day, this instrument gained +9.28% and was between 24,893.12 USDT and 27,741.14 USDT. This implies that the price is at +9.75% from its lowest and at -1.52% from its highest.The Central Gaps scanner detects a bullish opening. A small advantage for buyers in the very short term.
Bullish opening
Type : Bullish
Timeframe : Openning
Here is a more detailed summary of the historical variations registered by BITCOIN - BTC/USDT:
New HIGH record (1 year)
Type : Bullish
Timeframe : Weekly
New HIGH record (1st january)
Type : Bullish
Timeframe : Weekly
New HIGH record (1 month)
Type : Bullish
Timeframe : Weekly
Technical
Technical analysis of BITCOIN - BTC/USDT in Daily shows a strongly overall bullish trend. 92.86% of the signals given by moving averages are bullish. This strongly bullish trend is supported by the strong bullish signals given by short-term moving averages. The Central Indicators scanner detects a bullish signal on moving averages that could impact this trend:
Moving Average bullish crossovers : MA20 & MA50
Type : Bullish
Timeframe : Daily
In fact, 16 technical indicators on 18 studied are currently positioned bullish. But beware of excesses. The Central Indicators scanner currently detects this:
RSI indicator is overbought : over 70
Type : Neutral
Timeframe : Daily
CCI indicator is overbought : over 100
Type : Neutral
Timeframe : Daily
Williams %R indicator is overbought : over -20
Type : Neutral
Timeframe : Daily
Pivot points : price is over resistance 3
Type : Neutral
Timeframe : Daily
Pivot points : price is over resistance 3
Type : Neutral
Timeframe : Weekly
The Central Patterns scanner, which studies chart patterns, resistances and supports, has identified this signal:
Near resistance of channel
Type : Bearish
Timeframe : Daily
No result was found by the Central Candlesticks scanner on Japanese candlesticks.
| S3 | S2 | S1 | Price | R1 | R2 | R3 | |
|---|---|---|---|---|---|---|---|
| ProTrendLines | 21,619.90 | 23,745.40 | 24,842.80 | 27,320.12 | 29,848.90 | 40,624.10 | 47,434.00 |
| Change (%) | -20.86% | -13.08% | -9.07% | - | +9.26% | +48.70% | +73.62% |
| Change | -5,700.22 | -3,574.72 | -2,477.32 | - | +2,528.78 | +13,303.98 | +20,113.88 |
| Level | Major | Intermediate | Major | - | Minor | Minor | Minor |
Attention could also be paid to pivot points to set price objectives:
| Pivot points | S3 | S2 | S1 | PP | R1 | R2 | R3 |
|---|---|---|---|---|---|---|---|
| Standard | 23,345.97 | 23,738.89 | 24,369.03 | 24,761.95 | 25,392.09 | 25,785.01 | 26,415.15 |
| Camarilla | 24,717.84 | 24,811.62 | 24,905.40 | 24,999.18 | 25,092.96 | 25,186.74 | 25,280.52 |
| Woodie | 23,464.59 | 23,798.20 | 24,487.65 | 24,821.26 | 25,510.71 | 25,844.32 | 26,533.77 |
| Fibonacci | 23,738.89 | 24,129.70 | 24,371.14 | 24,761.95 | 25,152.76 | 25,394.20 | 25,785.01 |
| Pivot points | S3 | S2 | S1 | PP | R1 | R2 | R3 |
|---|---|---|---|---|---|---|---|
| Standard | 16,047.62 | 17,806.89 | 19,133.76 | 20,893.03 | 22,219.90 | 23,979.17 | 25,306.04 |
| Camarilla | 19,611.94 | 19,894.84 | 20,177.73 | 20,460.63 | 20,743.53 | 21,026.42 | 21,309.32 |
| Woodie | 15,831.42 | 17,698.79 | 18,917.56 | 20,784.93 | 22,003.70 | 23,871.07 | 25,089.84 |
| Fibonacci | 17,806.89 | 18,985.80 | 19,714.13 | 20,893.03 | 22,071.94 | 22,800.27 | 23,979.17 |
| Pivot points | S3 | S2 | S1 | PP | R1 | R2 | R3 |
|---|---|---|---|---|---|---|---|
| Standard | 17,815.47 | 19,588.53 | 21,694.97 | 23,468.03 | 25,574.47 | 27,347.53 | 29,453.97 |
| Camarilla | 22,734.54 | 23,090.16 | 23,445.78 | 23,801.40 | 24,157.02 | 24,512.64 | 24,868.26 |
| Woodie | 17,982.15 | 19,671.88 | 21,861.65 | 23,551.38 | 25,741.15 | 27,430.88 | 29,620.65 |
| Fibonacci | 19,588.53 | 21,070.50 | 21,986.06 | 23,468.03 | 24,950.00 | 25,865.56 | 27,347.53 |
Numerical data
The following is the status of technical indicators and moving averages registered at the time this technical analysis was created:
| RSI (14): | 72.22 | |
| MACD (12,26,9): | 615.3800 | |
| Directional Movement: | 31.40 | |
| AROON (14): | 50.00 | |
| DEMA (21): | 24,027.24 | |
| Parabolic SAR (0,02-0,02-0,2): | 20,434.27 | |
| Elder Ray (13): | 2,564.40 | |
| Super Trend (3,10): | 22,190.11 | |
| Zig ZAG (10): | 27,512.57 | |
| VORTEX (21): | 1.0200 | |
| Stochastique (14,3,5): | 82.33 | |
| TEMA (21): | 24,358.72 | |
| Williams %R (14): | -2.07 | |
| Chande Momentum Oscillator (20): | 5,136.52 | |
| Repulse (5,40,3): | 16.4900 | |
| ROCnROLL: | 1 | |
| TRIX (15,9): | 0.0300 | |
| Courbe Coppock: | 7.49 |
| MA7: | 24,018.29 | |
| MA20: | 23,113.03 | |
| MA50: | 23,068.20 | |
| MA100: | 20,361.36 | |
| MAexp7: | 24,596.54 | |
| MAexp20: | 23,405.80 | |
| MAexp50: | 22,505.29 | |
| MAexp100: | 21,370.32 | |
| Price / MA7: | +13.75% | |
| Price / MA20: | +18.20% | |
| Price / MA50: | +18.43% | |
| Price / MA100: | +34.18% | |
| Price / MAexp7: | +11.07% | |
| Price / MAexp20: | +16.72% | |
| Price / MAexp50: | +21.39% | |
| Price / MAexp100: | +27.84% |
About author

Online


Add a comment
Comments
0 comments on the analysis BITCOIN - BTC/USDT - Daily