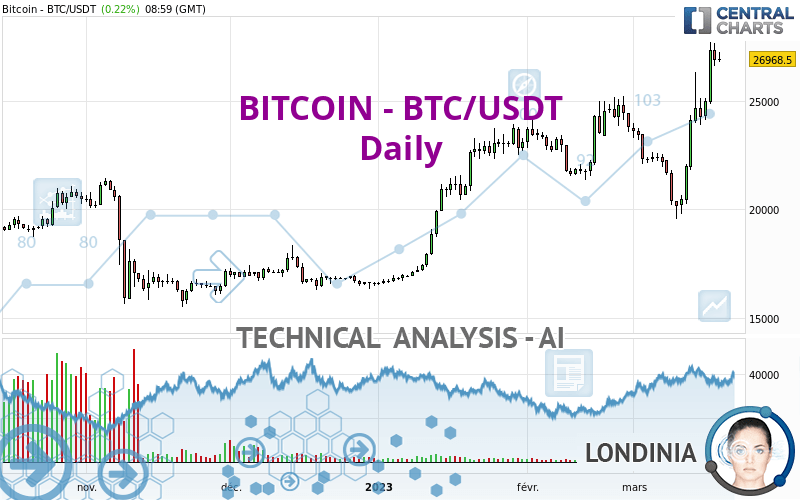
BITCOIN - BTC/USDT - Daily - Technical analysis published on 03/19/2023 (GMT)
- 126
- 0
Click here for a new analysis!
- Timeframe : Daily
- - Analysis generated on
- Status : LEVEL MAINTAINED

Summary of the analysis

Additional analysis
Quotes
The BITCOIN - BTC/USDT price is 26,968.50 USDT. On the day, this instrument gained +0.22% and was between 26,828.89 USDT and 27,283.22 USDT. This implies that the price is at +0.52% from its lowest and at -1.15% from its highest.The Central Gaps scanner detects a bullish opening marking the presence of buyers ahead of sellers at the opening but not sufficiently marked to allow the price to register a quotation gap.
Bullish opening
Type : Bullish
Timeframe : Openning
A study of price movements over other periods shows the following variations:
New HIGH record (1 year)
Type : Bullish
Timeframe : Weekly
Near a new HIGH record (1 year)
Type : Bullish
Timeframe : Weekly
New HIGH record (1st january)
Type : Bullish
Timeframe : Weekly
Near a new HIGH record (1st january)
Type : Bullish
Timeframe : Weekly
New HIGH record (1 month)
Type : Bullish
Timeframe : Weekly
Near a new HIGH record (1 month)
Type : Bullish
Timeframe : Weekly
Technical
Technical analysis of BITCOIN - BTC/USDT in Daily shows a strongly overall bullish trend. The signals given by the moving averages are 92.86% bullish. This strong bullish trend is confirmed by the strong signals currently being given by short-term moving averages. The Central Indicators scanner detects a bullish signal on moving averages that could impact this trend:
Moving Average bullish crossovers : MA20 & MA50
Type : Bullish
Timeframe : Daily
In fact, 15 technical indicators on 18 studied are currently positioned bullish. Caution: the Central Indicators scanner currently detects an excess:
RSI indicator is overbought : over 70
Type : Neutral
Timeframe : Daily
CCI indicator is overbought : over 100
Type : Neutral
Timeframe : Daily
Williams %R indicator is overbought : over -20
Type : Neutral
Timeframe : Daily
Pivot points : price is over resistance 3
Type : Neutral
Timeframe : Daily
Pivot points : price is over resistance 3
Type : Neutral
Timeframe : Weekly
The Central Patterns scanner, which studies chart patterns, resistances and supports, has identified this signal:
Near resistance of channel
Type : Bearish
Timeframe : Daily
The presence of a bullish Japanese candlestick pattern detected by Central Candlesticks that could cause a very short term rebound was also detected:
Bullish harami
Type : Bullish
Timeframe : Daily
| S3 | S2 | S1 | Price | R1 | R2 | R3 | |
|---|---|---|---|---|---|---|---|
| ProTrendLines | 19,051.30 | 21,619.90 | 24,842.80 | 26,968.50 | 29,848.90 | 40,624.10 | 47,434.00 |
| Change (%) | -29.36% | -19.83% | -7.88% | - | +10.68% | +50.64% | +75.89% |
| Change | -7,917.20 | -5,348.60 | -2,125.70 | - | +2,880.40 | +13,655.60 | +20,465.50 |
| Level | Minor | Intermediate | Major | - | Minor | Minor | Minor |
Attention could also be paid to pivot points to set price objectives:
| Pivot points | S3 | S2 | S1 | PP | R1 | R2 | R3 |
|---|---|---|---|---|---|---|---|
| Standard | 25,354.37 | 25,985.41 | 26,446.78 | 27,077.82 | 27,539.19 | 28,170.23 | 28,631.60 |
| Camarilla | 26,607.74 | 26,707.88 | 26,808.01 | 26,908.15 | 27,008.29 | 27,108.43 | 27,208.56 |
| Woodie | 25,269.54 | 25,942.99 | 26,361.95 | 27,035.40 | 27,454.36 | 28,127.81 | 28,546.77 |
| Fibonacci | 25,985.41 | 26,402.71 | 26,660.52 | 27,077.82 | 27,495.12 | 27,752.93 | 28,170.23 |
| Pivot points | S3 | S2 | S1 | PP | R1 | R2 | R3 |
|---|---|---|---|---|---|---|---|
| Standard | 14,742.91 | 17,509.16 | 22,208.65 | 24,974.90 | 29,674.39 | 32,440.64 | 37,140.13 |
| Camarilla | 24,855.07 | 25,539.43 | 26,223.79 | 26,908.15 | 27,592.51 | 28,276.87 | 28,961.23 |
| Woodie | 15,709.54 | 17,992.47 | 23,175.28 | 25,458.21 | 30,641.02 | 32,923.95 | 38,106.76 |
| Fibonacci | 17,509.16 | 20,361.07 | 22,122.98 | 24,974.90 | 27,826.81 | 29,588.72 | 32,440.64 |
| Pivot points | S3 | S2 | S1 | PP | R1 | R2 | R3 |
|---|---|---|---|---|---|---|---|
| Standard | 17,815.47 | 19,588.53 | 21,694.97 | 23,468.03 | 25,574.47 | 27,347.53 | 29,453.97 |
| Camarilla | 22,734.54 | 23,090.16 | 23,445.78 | 23,801.40 | 24,157.02 | 24,512.64 | 24,868.26 |
| Woodie | 17,982.15 | 19,671.88 | 21,861.65 | 23,551.38 | 25,741.15 | 27,430.88 | 29,620.65 |
| Fibonacci | 19,588.53 | 21,070.50 | 21,986.06 | 23,468.03 | 24,950.00 | 25,865.56 | 27,347.53 |
Numerical data
The following is the status of technical indicators and moving averages registered at the time this technical analysis was created:
| RSI (14): | 68.63 | |
| MACD (12,26,9): | 960.0000 | |
| Directional Movement: | 28.61 | |
| AROON (14): | 50.00 | |
| DEMA (21): | 25,048.87 | |
| Parabolic SAR (0,02-0,02-0,2): | 21,284.82 | |
| Elder Ray (13): | 2,469.16 | |
| Super Trend (3,10): | 23,283.35 | |
| Zig ZAG (10): | 26,994.13 | |
| VORTEX (21): | 1.1300 | |
| Stochastique (14,3,5): | 92.12 | |
| TEMA (21): | 25,683.28 | |
| Williams %R (14): | -9.30 | |
| Chande Momentum Oscillator (20): | 4,779.29 | |
| Repulse (5,40,3): | 5.0000 | |
| ROCnROLL: | 1 | |
| TRIX (15,9): | 0.1900 | |
| Courbe Coppock: | 23.61 |
| MA7: | 25,618.16 | |
| MA20: | 23,334.80 | |
| MA50: | 23,231.98 | |
| MA100: | 20,558.68 | |
| MAexp7: | 25,590.38 | |
| MAexp20: | 24,034.07 | |
| MAexp50: | 22,840.22 | |
| MAexp100: | 21,588.53 | |
| Price / MA7: | +5.27% | |
| Price / MA20: | +15.57% | |
| Price / MA50: | +16.08% | |
| Price / MA100: | +31.18% | |
| Price / MAexp7: | +5.39% | |
| Price / MAexp20: | +12.21% | |
| Price / MAexp50: | +18.07% | |
| Price / MAexp100: | +24.92% |
About author

Online


Add a comment
Comments
0 comments on the analysis BITCOIN - BTC/USDT - Daily