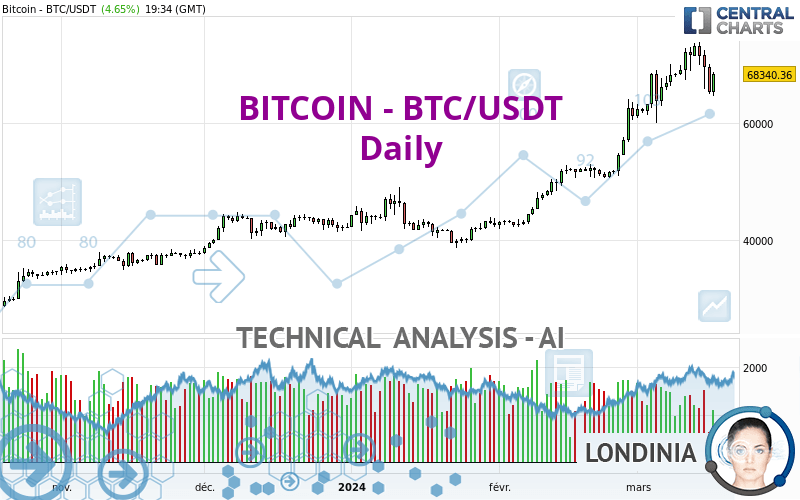
BITCOIN - BTC/USDT - Daily - Technical analysis published on 03/17/2024 (GMT)
- 85
- 0
Click here for a new analysis!
- Timeframe : Daily
- - Analysis generated on
- Status : LEVEL MAINTAINED
Summary of the analysis

Additional analysis
Quotes
The BITCOIN - BTC/USDT rating is 68,342.69 USDT. The price registered an increase of +4.65% on the session with the lowest point at 64,552.64 USDT and the highest point at 68,686.78 USDT. The deviation from the price is +5.87% for the low point and -0.50% for the high point.The Central Gaps scanner detects a bearish opening. A small advantage for sellers in the very short term.
Bearish opening
Type : Bearish
Timeframe : Openning
So that you have an overall view of the price change, here is a table showing the variations over several periods:
Near a new HIGH record (1 year)
Type : Bullish
Timeframe : Weekly
Near a new HIGH record (1st january)
Type : Bullish
Timeframe : Weekly
Near a new HIGH record (1 month)
Type : Bullish
Timeframe : Weekly
Technical
Technical analysis of this Daily chart of BITCOIN - BTC/USDT indicates that the overall trend is strongly bullish. 92.86% of the signals given by moving averages are bullish. This strongly bullish trend is supported by the strong bullish signals given by short-term moving averages. The Central Indicators market scanner is currently detecting several bullish signals that could impact this trend:
Bullish price crossover with Moving Average 20
Type : Bullish
Timeframe : Daily
Bullish price crossover with adaptative moving average 50
Type : Bullish
Timeframe : Daily
In fact, according to the parameters integrated into the Central Analyzer system, only 8 technical indicators out of 18 analysed are currently bullish. Other results related to technical indicators were also found by the Central Indicators scanner:
Pivot points : price is under support 1
Type : Neutral
Timeframe : Daily
Parabolic SAR indicator bearish reversal
Type : Bearish
Timeframe : Daily
Price is back over the pivot point
Type : Bullish
Timeframe : Daily
Price is back over the pivot point
Type : Bullish
Timeframe : Weekly
Momentum indicator is back over 0
Type : Bullish
Timeframe : Daily
No signals are given by Central Patterns, a market scanner specialised in chart patterns, resistances and supports.
No result was found by the Central Candlesticks scanner on Japanese candlesticks.
| S3 | S2 | S1 | Price | |
|---|---|---|---|---|
| ProTrendLines | 47,273.05 | 50,745.69 | 67,514.20 | 68,342.69 |
| Change (%) | -30.83% | -25.75% | -1.21% | - |
| Change | -21,069.64 | -17,597.00 | -828.49 | - |
| Level | Major | Intermediate | Major | - |
Pivot points can also be used to set your price objectives. Here is the price situation in relation to pivot points:
| Pivot points | S3 | S2 | S1 | PP | R1 | R2 | R3 |
|---|---|---|---|---|---|---|---|
| Standard | 58,154.82 | 61,480.62 | 63,392.08 | 66,717.88 | 68,629.34 | 71,955.14 | 73,866.60 |
| Camarilla | 63,863.28 | 64,343.37 | 64,823.45 | 65,303.53 | 65,783.61 | 66,263.69 | 66,743.78 |
| Woodie | 57,447.64 | 61,127.04 | 62,684.90 | 66,364.30 | 67,922.16 | 71,601.56 | 73,159.42 |
| Fibonacci | 61,480.62 | 63,481.26 | 64,717.25 | 66,717.88 | 68,718.52 | 69,954.51 | 71,955.14 |
| Pivot points | S3 | S2 | S1 | PP | R1 | R2 | R3 |
|---|---|---|---|---|---|---|---|
| Standard | 53,212.86 | 59,009.64 | 62,156.59 | 67,953.37 | 71,100.32 | 76,897.10 | 80,044.05 |
| Camarilla | 62,844.00 | 63,663.85 | 64,483.69 | 65,303.53 | 66,123.37 | 66,943.21 | 67,763.06 |
| Woodie | 51,887.94 | 58,347.18 | 60,831.67 | 67,290.91 | 69,775.40 | 76,234.64 | 78,719.13 |
| Fibonacci | 59,009.64 | 62,426.15 | 64,536.87 | 67,953.37 | 71,369.88 | 73,480.60 | 76,897.10 |
| Pivot points | S3 | S2 | S1 | PP | R1 | R2 | R3 |
|---|---|---|---|---|---|---|---|
| Standard | 25,183.22 | 33,533.95 | 47,334.75 | 55,685.48 | 69,486.28 | 77,837.01 | 91,637.81 |
| Camarilla | 55,043.89 | 57,074.45 | 59,105.00 | 61,135.56 | 63,166.12 | 65,196.67 | 67,227.23 |
| Woodie | 27,908.27 | 34,896.47 | 50,059.80 | 57,048.00 | 72,211.33 | 79,199.53 | 94,362.86 |
| Fibonacci | 33,533.95 | 41,995.83 | 47,223.59 | 55,685.48 | 64,147.36 | 69,375.12 | 77,837.01 |
Numerical data
The following is the status of technical indicators and moving averages registered at the time this technical analysis was created:
| RSI (14): | 59.90 | |
| MACD (12,26,9): | 4,167.3500 | |
| Directional Movement: | 6.87 | |
| AROON (14): | 64.28 | |
| DEMA (21): | 71,480.33 | |
| Parabolic SAR (0,02-0,02-0,2): | 73,392.41 | |
| Elder Ray (13): | -1,076.65 | |
| Super Trend (3,10): | 62,893.50 | |
| Zig ZAG (10): | 68,211.62 | |
| VORTEX (21): | 1.1600 | |
| Stochastique (14,3,5): | 55.76 | |
| TEMA (21): | 71,802.89 | |
| Williams %R (14): | -40.29 | |
| Chande Momentum Oscillator (20): | 4,485.12 | |
| Repulse (5,40,3): | 0.3900 | |
| ROCnROLL: | 1 | |
| TRIX (15,9): | 1.2500 | |
| Courbe Coppock: | 25.50 |
| MA7: | 70,130.19 | |
| MA20: | 66,466.47 | |
| MA50: | 55,311.73 | |
| MA100: | 49,087.94 | |
| MAexp7: | 68,716.66 | |
| MAexp20: | 65,601.45 | |
| MAexp50: | 58,078.06 | |
| MAexp100: | 51,238.17 | |
| Price / MA7: | -2.55% | |
| Price / MA20: | +2.82% | |
| Price / MA50: | +23.56% | |
| Price / MA100: | +39.23% | |
| Price / MAexp7: | -0.55% | |
| Price / MAexp20: | +4.18% | |
| Price / MAexp50: | +17.67% | |
| Price / MAexp100: | +33.38% |
About author

Online


Add a comment
Comments
0 comments on the analysis BITCOIN - BTC/USDT - Daily