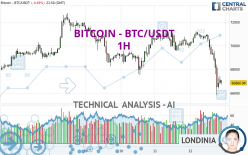
BITCOIN - BTC/USDT - 1H - Technical analysis published on 04/12/2024 (GMT)
- 135
- 0
Click here for a new analysis!
- Timeframe : 1H
- - Analysis generated on
- Status : TARGET REACHED

Summary of the analysis

Additional analysis
Quotes
BITCOIN - BTC/USDT rating 66,866.98 USDT. On the day, this instrument lost -4.49% and was between 65,805.48 USDT and 71,230.36 USDT. This implies that the price is at +1.61% from its lowest and at -6.13% from its highest.Here is a more detailed summary of the historical variations registered by BITCOIN - BTC/USDT:
Near a new HIGH record (5 years)
Type : Bullish
Timeframe : Weekly
Near a new HIGH record (1 year)
Type : Bullish
Timeframe : Weekly
Near a new HIGH record (1st january)
Type : Bullish
Timeframe : Weekly
Near a new HIGH record (1 month)
Type : Bullish
Timeframe : Weekly
Technical
A technical analysis in 1H of this BITCOIN - BTC/USDT chart shows a sharp bearish trend. 89.29% of the signals given by moving averages are bearish. The overall trend is supported by the strong bearish signals from short-term moving averages. The Central Indicators market scanner currently does not detect any result that concerns moving averages.
In fact, 10 technical indicators on 18 studied are currently bearish. But beware of excesses. The Central Indicators scanner currently detects this:
RSI indicator is oversold : under 30
Type : Neutral
Timeframe : 1 hour
CCI indicator is oversold : under -100
Type : Neutral
Timeframe : 1 hour
Williams %R indicator is oversold : under -80
Type : Neutral
Timeframe : 1 hour
Pivot points : price is under support 3
Type : Neutral
Timeframe : 1 hour
Price is back under the pivot point
Type : Bearish
Timeframe : Weekly
Central Patterns, the market scanner focusing on chart patterns, resistances and supports found this result:
Near support of channel
Type : Bullish
Timeframe : 1 hour
For a small setback in the very short term, the Central Candlesticks scanner currently notes the presence of this bearish pattern in Japanese candlesticks:
Black evening star
Type : Bearish
Timeframe : 1 hour
| S3 | S2 | S1 | Price | R1 | R2 | R3 | |
|---|---|---|---|---|---|---|---|
| ProTrendLines | 50,745.69 | 65,069.99 | 65,974.85 | 66,866.98 | 67,514.20 | 69,575.97 | 70,309.36 |
| Change (%) | -24.11% | -2.69% | -1.33% | - | +0.97% | +4.05% | +5.15% |
| Change | -16,121.29 | -1,796.99 | -892.13 | - | +647.22 | +2,708.99 | +3,442.38 |
| Level | Minor | Minor | Minor | - | Major | Intermediate | Minor |
To determine price objectives, it is also possible to use the pivot points. Here is the price position in relation to pivot points:
| Pivot points | S3 | S2 | S1 | PP | R1 | R2 | R3 |
|---|---|---|---|---|---|---|---|
| Standard | 67,562.52 | 68,567.23 | 69,287.61 | 70,292.32 | 71,012.70 | 72,017.41 | 72,737.79 |
| Camarilla | 69,533.59 | 69,691.72 | 69,849.86 | 70,007.99 | 70,166.12 | 70,324.26 | 70,482.39 |
| Woodie | 67,420.36 | 68,496.15 | 69,145.45 | 70,221.24 | 70,870.54 | 71,946.33 | 72,595.63 |
| Fibonacci | 68,567.23 | 69,226.21 | 69,633.34 | 70,292.32 | 70,951.30 | 71,358.43 | 72,017.41 |
| Pivot points | S3 | S2 | S1 | PP | R1 | R2 | R3 |
|---|---|---|---|---|---|---|---|
| Standard | 58,359.82 | 61,457.01 | 65,176.51 | 68,273.70 | 71,993.20 | 75,090.39 | 78,809.89 |
| Camarilla | 67,021.43 | 67,646.29 | 68,271.16 | 68,896.02 | 69,520.88 | 70,145.75 | 70,770.61 |
| Woodie | 58,670.99 | 61,612.59 | 65,487.68 | 68,429.28 | 72,304.37 | 75,245.97 | 79,121.06 |
| Fibonacci | 61,457.01 | 64,060.98 | 65,669.72 | 68,273.70 | 70,877.67 | 72,486.41 | 75,090.39 |
| Pivot points | S3 | S2 | S1 | PP | R1 | R2 | R3 |
|---|---|---|---|---|---|---|---|
| Standard | 49,192.79 | 54,597.00 | 62,941.73 | 68,345.94 | 76,690.67 | 82,094.88 | 90,439.61 |
| Camarilla | 67,505.49 | 68,765.81 | 70,026.13 | 71,286.45 | 72,546.77 | 73,807.09 | 75,067.41 |
| Woodie | 50,663.04 | 55,332.13 | 64,411.98 | 69,081.07 | 78,160.92 | 82,830.01 | 91,909.86 |
| Fibonacci | 54,597.00 | 59,849.10 | 63,093.85 | 68,345.94 | 73,598.04 | 76,842.79 | 82,094.88 |
Numerical data
The following is the status of the technical indicators and moving averages at the time of publication of this technical analysis:
| RSI (14): | 25.30 | |
| MACD (12,26,9): | -893.1800 | |
| Directional Movement: | -32.26 | |
| AROON (14): | -42.86 | |
| DEMA (21): | 67,988.20 | |
| Parabolic SAR (0,02-0,02-0,2): | 68,959.17 | |
| Elder Ray (13): | -1,517.78 | |
| Super Trend (3,10): | 69,201.25 | |
| Zig ZAG (10): | 66,773.73 | |
| VORTEX (21): | 0.7500 | |
| Stochastique (14,3,5): | 21.25 | |
| TEMA (21): | 67,167.02 | |
| Williams %R (14): | -81.94 | |
| Chande Momentum Oscillator (20): | -3,915.64 | |
| Repulse (5,40,3): | -1.6300 | |
| ROCnROLL: | 2 | |
| TRIX (15,9): | -0.0900 | |
| Courbe Coppock: | 8.90 |
| MA7: | 69,494.79 | |
| MA20: | 69,099.14 | |
| MA50: | 66,213.85 | |
| MA100: | 55,661.39 | |
| MAexp7: | 67,625.53 | |
| MAexp20: | 68,937.80 | |
| MAexp50: | 69,633.61 | |
| MAexp100: | 69,696.26 | |
| Price / MA7: | -3.78% | |
| Price / MA20: | -3.23% | |
| Price / MA50: | +0.99% | |
| Price / MA100: | +20.13% | |
| Price / MAexp7: | -1.12% | |
| Price / MAexp20: | -3.00% | |
| Price / MAexp50: | -3.97% | |
| Price / MAexp100: | -4.06% |
About author

Online


Add a comment
Comments
0 comments on the analysis BITCOIN - BTC/USDT - 1H