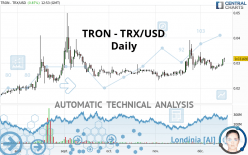
TRON - TRX/USD - Daily - Technical analysis published on 12/17/2020 (GMT)
- 198
- 0
Click here for a new analysis!
- Timeframe : Daily
- - Analysis generated on
- Status : TARGET REACHED
Summary of the analysis

Additional analysis
Quotes
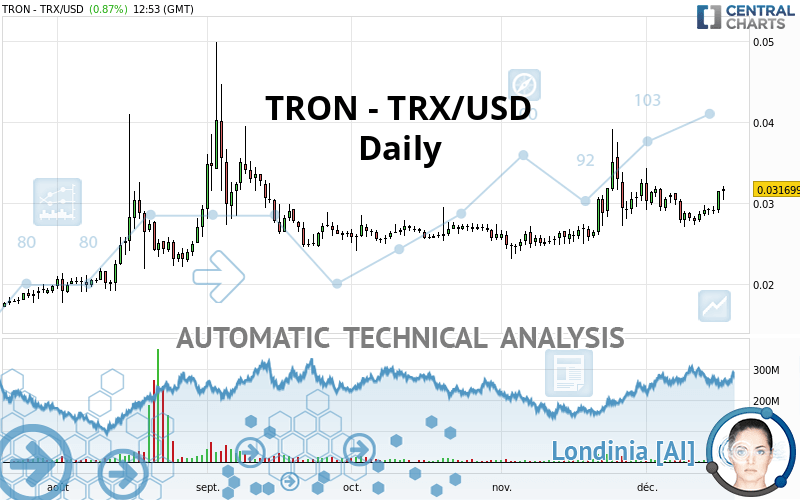
The TRON - TRX/USD price is 0.031699 USD. The price registered an increase of +0.87% on the session and was between 0.030373 USD and 0.032059 USD. This implies that the price is at +4.37% from its lowest and at -1.12% from its highest.The Central Gaps scanner detects a bearish opening. A small advantage for sellers in the very short term.
Bearish opening
Type : Bearish
Timeframe : Openning
Here is a more detailed summary of the historical variations registered by TRON - TRX/USD:
Technical
Technical analysis of TRON - TRX/USD in Daily shows a strongly overall bullish trend. 82.14% of the signals given by moving averages are bullish. This strongly bullish trend is supported by the strong bullish signals given by short-term moving averages. The Central Indicators market scanner is currently detecting several bullish signals that could impact this trend:
Bullish trend reversal : Moving Average 20
Type : Bullish
Timeframe : Daily
Bullish trend reversal : adaptative moving average 20
Type : Bullish
Timeframe : Daily
Bullish price crossover with Moving Average 20
Type : Bullish
Timeframe : Daily
Bullish price crossover with adaptative moving average 20
Type : Bullish
Timeframe : Daily
In fact, according to the parameters integrated into the Central Analyzer system, 14 technical indicators out of 18 analysed are currently bullish. Caution: the Central Indicators scanner currently detects an excess:
Williams %R indicator is overbought : over -20
Type : Neutral
Timeframe : Daily
Pivot points : price is over resistance 1
Type : Neutral
Timeframe : Weekly
Price is back over the pivot point
Type : Bullish
Timeframe : Daily
Price is back under the pivot point
Type : Bearish
Timeframe : Weekly
Momentum indicator is back over 0
Type : Bullish
Timeframe : Daily
Williams %R indicator is back over -50
Type : Bullish
Timeframe : Daily
The Central Patterns scanner, which studies chart patterns, resistances and supports, has identified these signals:
Near resistance of triangle
Type : Bearish
Timeframe : Daily
Horizontal resistance is broken
Type : Bullish
Timeframe : Daily
Resistance of channel is broken
Type : Bullish
Timeframe : Daily
The Central Candlesticks scanner which studies Japanese candlesticks did not detect anything.
| S3 | S2 | S1 | Price | R1 | R2 | R3 | |
|---|---|---|---|---|---|---|---|
| ProTrendLines | 0.024678 | 0.026633 | 0.030376 | 0.031699 | 0.032524 | 0.035073 | 0.038347 |
| Change (%) | -22.15% | -15.98% | -4.17% | - | +2.60% | +10.64% | +20.97% |
| Change | -0.007021 | -0.005066 | -0.001323 | - | +0.000825 | +0.003374 | +0.006648 |
| Level | Intermediate | Major | Minor | - | Minor | Major | Intermediate |
Pivot points can also be used to set your price objectives. Here is the price situation in relation to pivot points:
| Pivot points | S3 | S2 | S1 | PP | R1 | R2 | R3 |
|---|---|---|---|---|---|---|---|
| Standard | 0.027027 | 0.027910 | 0.029669 | 0.030552 | 0.032311 | 0.033194 | 0.034953 |
| Camarilla | 0.030701 | 0.030943 | 0.031185 | 0.031427 | 0.031669 | 0.031911 | 0.032154 |
| Woodie | 0.027464 | 0.028129 | 0.030106 | 0.030771 | 0.032748 | 0.033413 | 0.035390 |
| Fibonacci | 0.027910 | 0.028920 | 0.029543 | 0.030552 | 0.031562 | 0.032185 | 0.033194 |
| Pivot points | S3 | S2 | S1 | PP | R1 | R2 | R3 |
|---|---|---|---|---|---|---|---|
| Standard | 0.022343 | 0.024671 | 0.026622 | 0.028950 | 0.030901 | 0.033229 | 0.035180 |
| Camarilla | 0.027396 | 0.027789 | 0.028181 | 0.028573 | 0.028965 | 0.029358 | 0.029750 |
| Woodie | 0.022155 | 0.024577 | 0.026434 | 0.028856 | 0.030713 | 0.033135 | 0.034992 |
| Fibonacci | 0.024671 | 0.026306 | 0.027315 | 0.028950 | 0.030585 | 0.031594 | 0.033229 |
| Pivot points | S3 | S2 | S1 | PP | R1 | R2 | R3 |
|---|---|---|---|---|---|---|---|
| Standard | 0.007934 | 0.015510 | 0.024017 | 0.031593 | 0.040100 | 0.047676 | 0.056183 |
| Camarilla | 0.028101 | 0.029575 | 0.031050 | 0.032524 | 0.033998 | 0.035473 | 0.036947 |
| Woodie | 0.008400 | 0.015743 | 0.024483 | 0.031826 | 0.040566 | 0.047909 | 0.056649 |
| Fibonacci | 0.015510 | 0.021654 | 0.025449 | 0.031593 | 0.037737 | 0.041532 | 0.047676 |
Numerical data
The following is the status of the technical indicators and moving averages at the time of publication of this technical analysis:
| RSI (14): | 58.68 | |
| MACD (12,26,9): | 0.0004 | |
| Directional Movement: | 13.551060 | |
| AROON (14): | 57.142857 | |
| DEMA (21): | 0.030242 | |
| Parabolic SAR (0,02-0,02-0,2): | 0.033770 | |
| Elder Ray (13): | 0.001396 | |
| Super Trend (3,10): | 0.027085 | |
| Zig ZAG (10): | 0.031609 | |
| VORTEX (21): | 1.0795 | |
| Stochastique (14,3,5): | 74.92 | |
| TEMA (21): | 0.030041 | |
| Williams %R (14): | -5.49 | |
| Chande Momentum Oscillator (20): | 0.001348 | |
| Repulse (5,40,3): | 10.6865 | |
| ROCnROLL: | 1 | |
| TRIX (15,9): | 0.1737 | |
| Courbe Coppock: | 7.67 |
| MA7: | 0.029571 | |
| MA20: | 0.030001 | |
| MA50: | 0.028187 | |
| MA100: | 0.027713 | |
| MAexp7: | 0.030171 | |
| MAexp20: | 0.029652 | |
| MAexp50: | 0.028754 | |
| MAexp100: | 0.027381 | |
| Price / MA7: | +7.20% | |
| Price / MA20: | +5.66% | |
| Price / MA50: | +12.46% | |
| Price / MA100: | +14.38% | |
| Price / MAexp7: | +5.06% | |
| Price / MAexp20: | +6.90% | |
| Price / MAexp50: | +10.24% | |
| Price / MAexp100: | +15.77% |
About author

Online


Add a comment
Comments
0 comments on the analysis TRON - TRX/USD - Daily