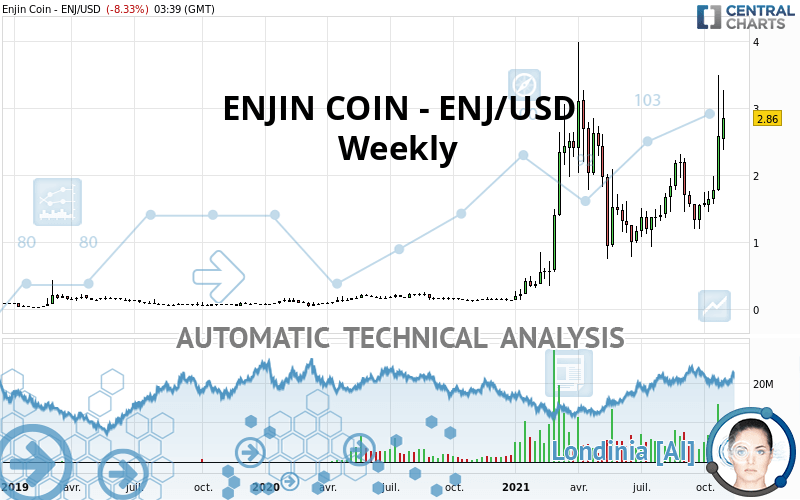
ENJIN COIN - ENJ/USD - Weekly - Technical analysis published on 11/03/2021 (GMT)
- 138
- 0
Click here for a new analysis!
- Timeframe : Weekly
- - Analysis generated on
- Status : TARGET REACHED

Summary of the analysis

Additional analysis
Quotes
The ENJIN COIN - ENJ/USD price is 2.86 USD. Over 5 days, this instrument gained +23.28% and was traded between 2.29 USD and 3.50 USD over the period. The price is currently at +24.89% from its lowest point and -18.29% from its highest point.A study of price movements over other periods shows the following variations:
Abnormal volumes
Timeframe : 5 days
Technical
Technical analysis of ENJIN COIN - ENJ/USD in Weekly shows a strongly overall bullish trend. 92.86% of the signals given by moving averages are bullish. This strongly bullish trend is supported by the strong bullish signals given by short-term moving averages. An assessment of moving averages reveals several bullish signals that could impact this trend:
Bullish price crossover with adaptative moving average 20
Type : Bullish
Timeframe : Weekly
Bullish price crossover with adaptative moving average 50
Type : Bullish
Timeframe : Weekly
Bullish price crossover with adaptative moving average 100
Type : Bullish
Timeframe : Weekly
In fact, 15 technical indicators on 18 studied are currently positioned bullish. Caution: the Central Indicators scanner currently detects an excess:
RSI indicator is overbought : over 70
Type : Neutral
Timeframe : Weekly
CCI indicator is overbought : over 100
Type : Neutral
Timeframe : Weekly
Williams %R indicator is overbought : over -20
Type : Neutral
Timeframe : Weekly
MACD crosses UP its Moving Average
Type : Bullish
Timeframe : Weekly
Ichimoku : price is over the cloud
Type : Bullish
Timeframe : Weekly
SuperTrend indicator bullish reversal
Type : Bullish
Timeframe : Weekly
Ichimoku - Bullish crossover : Tenkan & Kijun
Type : Bullish
Timeframe : Weekly
Price is back over the pivot point
Type : Bullish
Timeframe : Weekly
Central Patterns, the scanner specializing in chart patterns, did not identify any signals.
No result was found by the Central Candlesticks scanner on Japanese candlesticks.
| S3 | S2 | S1 | Price | R1 | |
|---|---|---|---|---|---|
| ProTrendLines | 0.92 | 1.20 | 2.19 | 2.86 | 3.42 |
| Change (%) | -67.83% | -58.04% | -23.43% | - | +19.58% |
| Change | -1.94 | -1.66 | -0.67 | - | +0.56 |
| Level | Major | Intermediate | Major | - | Major |
To determine price objectives, it is also possible to use the pivot points. Here is the price position in relation to pivot points:
| Pivot points | S3 | S2 | S1 | PP | R1 | R2 | R3 |
|---|---|---|---|---|---|---|---|
| Standard | 2.00 | 2.29 | 2.70 | 2.99 | 3.40 | 3.69 | 4.10 |
| Camarilla | 2.93 | 2.99 | 3.06 | 3.12 | 3.18 | 3.25 | 3.31 |
| Woodie | 2.07 | 2.32 | 2.77 | 3.02 | 3.47 | 3.72 | 4.17 |
| Fibonacci | 2.29 | 2.55 | 2.72 | 2.99 | 3.25 | 3.42 | 3.69 |
| Pivot points | S3 | S2 | S1 | PP | R1 | R2 | R3 |
|---|---|---|---|---|---|---|---|
| Standard | 0.52 | 1.12 | 2.09 | 2.69 | 3.66 | 4.26 | 5.23 |
| Camarilla | 2.62 | 2.76 | 2.91 | 3.05 | 3.19 | 3.34 | 3.48 |
| Woodie | 0.70 | 1.21 | 2.27 | 2.78 | 3.84 | 4.35 | 5.41 |
| Fibonacci | 1.12 | 1.72 | 2.09 | 2.69 | 3.29 | 3.66 | 4.26 |
| Pivot points | S3 | S2 | S1 | PP | R1 | R2 | R3 |
|---|---|---|---|---|---|---|---|
| Standard | -0.80 | 0.25 | 1.41 | 2.46 | 3.62 | 4.67 | 5.83 |
| Camarilla | 1.97 | 2.18 | 2.38 | 2.58 | 2.78 | 2.99 | 3.19 |
| Woodie | -0.74 | 0.28 | 1.48 | 2.49 | 3.69 | 4.70 | 5.90 |
| Fibonacci | 0.25 | 1.09 | 1.61 | 2.46 | 3.30 | 3.82 | 4.67 |
Numerical data
The following is the status of technical indicators and moving averages registered at the time this technical analysis was created:
| RSI (14): | 67.07 | |
| MACD (12,26,9): | 0.2700 | |
| Directional Movement: | 19.17 | |
| AROON (14): | 42.86 | |
| DEMA (21): | 2.17 | |
| Parabolic SAR (0,02-0,02-0,2): | 1.33 | |
| Elder Ray (13): | 0.94 | |
| Super Trend (3,10): | 1.11 | |
| Zig ZAG (10): | 2.87 | |
| VORTEX (21): | 1.1200 | |
| Stochastique (14,3,5): | 75.37 | |
| TEMA (21): | 2.26 | |
| Williams %R (14): | -27.71 | |
| Chande Momentum Oscillator (20): | 1.18 | |
| Repulse (5,40,3): | 34.9100 | |
| ROCnROLL: | 1 | |
| TRIX (15,9): | 1.3300 | |
| Courbe Coppock: | 108.88 |
| MA7: | 2.71 | |
| MA20: | 2.12 | |
| MA50: | 1.75 | |
| MA100: | 1.73 | |
| MAexp7: | 2.24 | |
| MAexp20: | 1.86 | |
| MAexp50: | 1.44 | |
| MAexp100: | 1.02 | |
| Price / MA7: | +5.54% | |
| Price / MA20: | +34.91% | |
| Price / MA50: | +63.43% | |
| Price / MA100: | +65.32% | |
| Price / MAexp7: | +27.68% | |
| Price / MAexp20: | +53.76% | |
| Price / MAexp50: | +98.61% | |
| Price / MAexp100: | +180.39% |
About author

Online


Add a comment
Comments
0 comments on the analysis ENJIN COIN - ENJ/USD - Weekly