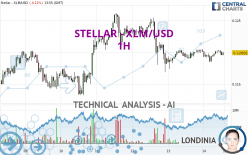
STELLAR - XLM/USD - 1H - Technical analysis published on 01/14/2024 (GMT)
- 126
- 0
Click here for a new analysis!
- Timeframe : 1H
- - Analysis generated on
- Status : TARGET REACHED

Summary of the analysis

Additional analysis
Quotes
The STELLAR - XLM/USD price is 0.119932 USD. The price registered a decrease of -0.12% on the session with the lowest point at 0.118450 USD and the highest point at 0.120327 USD. The deviation from the price is +1.25% for the low point and -0.33% for the high point.A bullish opening was detected by the Central Gaps scanner. Buyers are trying to impose a bullish momentum in the very short term.
Bullish opening
Type : Bullish
Timeframe : Openning
A study of price movements over other periods shows the following variations:
Near a new LOW record (1st january)
Type : Bearish
Timeframe : Weekly
Near a new LOW record (1 month)
Type : Bearish
Timeframe : Weekly
Abnormal volumes on STELLAR - XLM/USD were detected by the Central Volumes scanner:
Abnormal volumes
Timeframe : 5 days
Abnormal volumes
Timeframe : 20 days
Abnormal volumes
Timeframe : 50 days
Technical
A technical analysis in 1H of this STELLAR - XLM/USD chart shows a bearish trend. 67.86% of the signals given by moving averages are bearish. Caution: the neutral signals currently given by short-term moving averages show us that the global trend is losing momentum. The Central Indicators scanner detects bearish signals on moving averages that could impact this trend:
Bearish trend reversal : Moving Average 50
Type : Bearish
Timeframe : 1 hour
Bearish trend reversal : adaptative moving average 20
Type : Bearish
Timeframe : 1 hour
Bearish price crossover with Moving Average 100
Type : Bearish
Timeframe : 1 hour
In fact, Central Analyzer took into account 18 technical indicators and the result was as follows: 8 are bullish, 4 are neutral and 6 are bearish. But beware of excesses. The Central Indicators scanner currently detects this:
RSI indicator is oversold : under 30
Type : Neutral
Timeframe : 1 hour
Pivot points : price is under support 3
Type : Neutral
Timeframe : 1 hour
Aroon indicator bullish trend
Type : Bullish
Timeframe : 1 hour
Price is back under the pivot point
Type : Bearish
Timeframe : Weekly
An analysis of the price chart with the Central Patterns scanner (detector of chart patterns and resistances and supports) shows a result that can have an impact on the price change:
Support of channel is broken
Type : Bearish
Timeframe : 1 hour
There is also a Japanese candlestick pattern detected by Central Candlesticks that could mark the end of the current short-term trend:
Doji
Type : Neutral
Timeframe : 1 hour
| S3 | S2 | S1 | Price | R1 | R2 | R3 | |
|---|---|---|---|---|---|---|---|
| ProTrendLines | 0.116001 | 0.118027 | 0.119499 | 0.119932 | 0.122161 | 0.124171 | 0.126150 |
| Change (%) | -3.28% | -1.59% | -0.36% | - | +1.86% | +3.53% | +5.18% |
| Change | -0.003931 | -0.001905 | -0.000433 | - | +0.002229 | +0.004239 | +0.006218 |
| Level | Minor | Intermediate | Intermediate | - | Minor | Minor | Intermediate |
Pivot points can also be used to set your price objectives. Here is the price situation in relation to pivot points:
| Pivot points | S3 | S2 | S1 | PP | R1 | R2 | R3 |
|---|---|---|---|---|---|---|---|
| Standard | 0.114996 | 0.116181 | 0.118128 | 0.119313 | 0.121260 | 0.122445 | 0.124392 |
| Camarilla | 0.119215 | 0.119502 | 0.119789 | 0.120076 | 0.120363 | 0.120650 | 0.120937 |
| Woodie | 0.115378 | 0.116372 | 0.118510 | 0.119504 | 0.121642 | 0.122636 | 0.124774 |
| Fibonacci | 0.116181 | 0.117377 | 0.118116 | 0.119313 | 0.120509 | 0.121248 | 0.122445 |
| Pivot points | S3 | S2 | S1 | PP | R1 | R2 | R3 |
|---|---|---|---|---|---|---|---|
| Standard | 0.099351 | 0.105925 | 0.113001 | 0.119575 | 0.126651 | 0.133225 | 0.140301 |
| Camarilla | 0.116322 | 0.117574 | 0.118825 | 0.120076 | 0.121327 | 0.122579 | 0.123830 |
| Woodie | 0.099601 | 0.106051 | 0.113251 | 0.119701 | 0.126901 | 0.133351 | 0.140551 |
| Fibonacci | 0.105925 | 0.111140 | 0.114361 | 0.119575 | 0.124790 | 0.128011 | 0.133225 |
| Pivot points | S3 | S2 | S1 | PP | R1 | R2 | R3 |
|---|---|---|---|---|---|---|---|
| Standard | 0.095165 | 0.105664 | 0.117362 | 0.127861 | 0.139559 | 0.150058 | 0.161756 |
| Camarilla | 0.122956 | 0.124991 | 0.127025 | 0.129060 | 0.131095 | 0.133130 | 0.135164 |
| Woodie | 0.095765 | 0.105964 | 0.117962 | 0.128161 | 0.140159 | 0.150358 | 0.162356 |
| Fibonacci | 0.105664 | 0.114143 | 0.119382 | 0.127861 | 0.136340 | 0.141579 | 0.150058 |
Numerical data
The following are the details of the technical indicators and moving averages that were collected to generate this technical analysis:
| RSI (14): | 46.57 | |
| MACD (12,26,9): | -0.0001 | |
| Directional Movement: | -8.628904 | |
| AROON (14): | 42.857143 | |
| DEMA (21): | 0.119634 | |
| Parabolic SAR (0,02-0,02-0,2): | 0.118728 | |
| Elder Ray (13): | -0.000159 | |
| Super Trend (3,10): | 0.121009 | |
| Zig ZAG (10): | 0.119552 | |
| VORTEX (21): | 1.0221 | |
| Stochastique (14,3,5): | 62.92 | |
| TEMA (21): | 0.119803 | |
| Williams %R (14): | -43.37 | |
| Chande Momentum Oscillator (20): | 0.000039 | |
| Repulse (5,40,3): | -0.3380 | |
| ROCnROLL: | 2 | |
| TRIX (15,9): | -0.0129 | |
| Courbe Coppock: | 0.26 |
| MA7: | 0.119878 | |
| MA20: | 0.124152 | |
| MA50: | 0.124042 | |
| MA100: | 0.119914 | |
| MAexp7: | 0.119756 | |
| MAexp20: | 0.119782 | |
| MAexp50: | 0.120070 | |
| MAexp100: | 0.120071 | |
| Price / MA7: | +0.05% | |
| Price / MA20: | -3.40% | |
| Price / MA50: | -3.31% | |
| Price / MA100: | +0.02% | |
| Price / MAexp7: | +0.15% | |
| Price / MAexp20: | +0.13% | |
| Price / MAexp50: | -0.11% | |
| Price / MAexp100: | -0.12% |
About author
Online


Add a comment
Comments
0 comments on the analysis STELLAR - XLM/USD - 1H