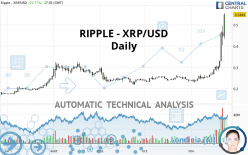
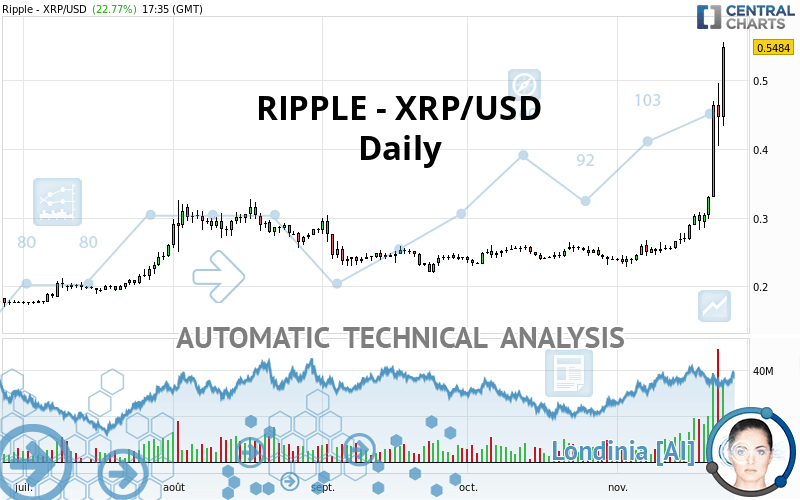
RIPPLE - XRP/USD - Daily - Technical analysis published on 11/23/2020 (GMT)
- 290
- 0
Click here for a new analysis!
- Timeframe : Daily
- - Analysis generated on
- Status : TARGET REACHED
Summary of the analysis

Additional analysis
Quotes
The RIPPLE - XRP/USD price is 0.548400 USD. On the day, this instrument gained +22.77% with the lowest point at 0.432700 USD and the highest point at 0.555600 USD. The deviation from the price is +26.74% for the low point and -1.30% for the high point.A study of price movements over other periods shows the following variations:
New HIGH record (1 year)
Type : Bullish
Timeframe : Weekly
New HIGH record (1st january)
Type : Bullish
Timeframe : Weekly
New HIGH record (1 month)
Type : Bullish
Timeframe : Weekly
The Central Volumes scanner detects abnormal volumes on the asset:
Abnormal volumes
Timeframe : 5 days
Technical
A technical analysis in Daily of this RIPPLE - XRP/USD chart shows a strongly bullish trend. 92.86% of the signals given by moving averages are bullish. The overall trend is supported by the strong bullish signals from short-term moving averages. The Central Indicators scanner detects a bullish signal on moving averages that could impact this trend:
Moving Average bullish crossovers : MA50 & MA100
Type : Bullish
Timeframe : Daily
In fact, 16 technical indicators on 18 studied are currently positioned bullish. Caution: the Central Indicators scanner currently detects an excess:
RSI indicator is overbought : over 80
Type : Neutral
Timeframe : Daily
CCI indicator is overbought : over 100
Type : Neutral
Timeframe : Daily
Previous candle closed over Bollinger bands
Type : Neutral
Timeframe : Daily
Williams %R indicator is overbought : over -20
Type : Neutral
Timeframe : Daily
Pivot points : price is over resistance 1
Type : Neutral
Timeframe : Daily
Pivot points : price is over resistance 1
Type : Neutral
Timeframe : Weekly
Price is back under the pivot point
Type : Bearish
Timeframe : Daily
The Central Patterns scanner, which studies chart patterns, resistances and supports, has identified this signal:
Near horizontal resistance
Type : Bearish
Timeframe : Daily
For a small setback in the very short term, the Central Candlesticks scanner currently notes the presence of this bearish pattern in Japanese candlesticks:
Long black line
Type : Bearish
Timeframe : Daily
| S3 | S2 | S1 | Price | R1 | R2 | |
|---|---|---|---|---|---|---|
| ProTrendLines | 0.295000 | 0.314327 | 0.473900 | 0.548400 | 0.582300 | 0.923400 |
| Change (%) | -46.21% | -42.68% | -13.58% | - | +6.18% | +68.38% |
| Change | -0.253400 | -0.234073 | -0.074500 | - | +0.033900 | +0.375000 |
| Level | Minor | Major | Major | - | Minor | Minor |
Attention could also be paid to pivot points to set price objectives:
| Pivot points | S3 | S2 | S1 | PP | R1 | R2 | R3 |
|---|---|---|---|---|---|---|---|
| Standard | 0.309133 | 0.356567 | 0.401633 | 0.449067 | 0.494133 | 0.541567 | 0.586633 |
| Camarilla | 0.421263 | 0.429742 | 0.438221 | 0.446700 | 0.455179 | 0.463658 | 0.472138 |
| Woodie | 0.307950 | 0.355975 | 0.400450 | 0.448475 | 0.492950 | 0.540975 | 0.585450 |
| Fibonacci | 0.356567 | 0.391902 | 0.413732 | 0.449067 | 0.484402 | 0.506232 | 0.541567 |
| Pivot points | S3 | S2 | S1 | PP | R1 | R2 | R3 |
|---|---|---|---|---|---|---|---|
| Standard | 0.124233 | 0.194267 | 0.329033 | 0.399067 | 0.533833 | 0.603867 | 0.738633 |
| Camarilla | 0.407480 | 0.426253 | 0.445027 | 0.463800 | 0.482573 | 0.501347 | 0.520120 |
| Woodie | 0.156600 | 0.210450 | 0.361400 | 0.415250 | 0.566200 | 0.620050 | 0.771000 |
| Fibonacci | 0.194267 | 0.272500 | 0.320833 | 0.399067 | 0.477300 | 0.525633 | 0.603867 |
| Pivot points | S3 | S2 | S1 | PP | R1 | R2 | R3 |
|---|---|---|---|---|---|---|---|
| Standard | 0.189800 | 0.209400 | 0.224700 | 0.244300 | 0.259600 | 0.279200 | 0.294500 |
| Camarilla | 0.230403 | 0.233602 | 0.236801 | 0.240000 | 0.243199 | 0.246398 | 0.249598 |
| Woodie | 0.187650 | 0.208325 | 0.222550 | 0.243225 | 0.257450 | 0.278125 | 0.292350 |
| Fibonacci | 0.209400 | 0.222732 | 0.230968 | 0.244300 | 0.257632 | 0.265868 | 0.279200 |
Numerical data
The following is the status of the technical indicators and moving averages at the time of publication of this technical analysis:
| RSI (14): | 89.67 | |
| MACD (12,26,9): | 0.0515 | |
| Directional Movement: | 50.064231 | |
| AROON (14): | 100.000000 | |
| DEMA (21): | 0.385704 | |
| Parabolic SAR (0,02-0,02-0,2): | 0.330000 | |
| Elder Ray (13): | 0.133615 | |
| Super Trend (3,10): | 0.361422 | |
| Zig ZAG (10): | 0.542000 | |
| VORTEX (21): | 1.3119 | |
| Stochastique (14,3,5): | 91.11 | |
| TEMA (21): | 0.426650 | |
| Williams %R (14): | -6.54 | |
| Chande Momentum Oscillator (20): | 0.278100 | |
| Repulse (5,40,3): | 41.2566 | |
| ROCnROLL: | 1 | |
| TRIX (15,9): | 1.2807 | |
| Courbe Coppock: | 111.75 |
| MA7: | 0.382286 | |
| MA20: | 0.302145 | |
| MA50: | 0.269478 | |
| MA100: | 0.263491 | |
| MAexp7: | 0.408030 | |
| MAexp20: | 0.329744 | |
| MAexp50: | 0.285851 | |
| MAexp100: | 0.265583 | |
| Price / MA7: | +43.45% | |
| Price / MA20: | +81.50% | |
| Price / MA50: | +103.50% | |
| Price / MA100: | +108.13% | |
| Price / MAexp7: | +34.40% | |
| Price / MAexp20: | +66.31% | |
| Price / MAexp50: | +91.85% | |
| Price / MAexp100: | +106.49% |
About author

Online


Add a comment
Comments
0 comments on the analysis RIPPLE - XRP/USD - Daily