RIPPLE - XRP/USD - Weekly - Technical analysis published on 12/06/2021 (GMT)
- 239
- 0
- Timeframe : Weekly
- - Analysis generated on
- Status : NEUTRAL
Summary of the analysis
Trends
Short term:
Bearish
Underlying:
Slightly bullish
Technical indicators
11%
56%
33%
My opinion
Neutral between 0.690000 USD and 0.990000 USD
My targets
-
My analysis
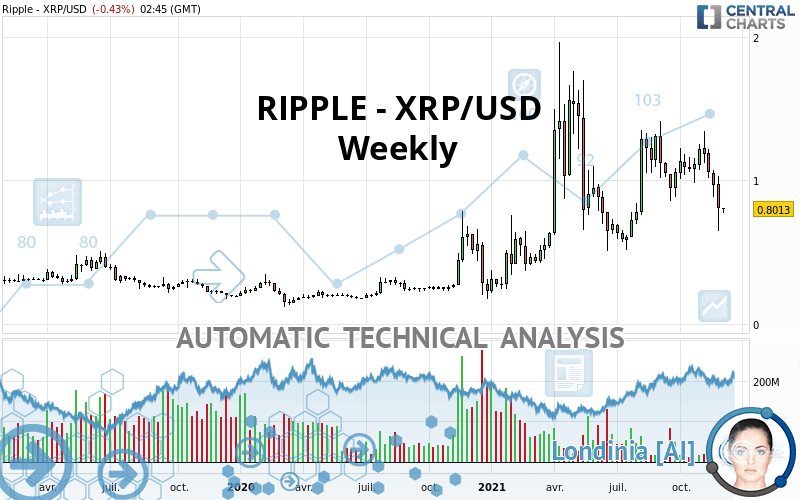
The short-term decline on RIPPLE - XRP/USD remains moderate but it could call into question the slightly bullish basic trend. It is difficult to advise a trading direction under these conditions. The first support is located at 0.690000 USD. The first resistance is located at 0.990000 USD. You could remain on the sidelines waiting for a more pronounced price movement on this instrument. A new analysis could then be carried out to provide clearer signals.
In the very short term, technical indicators are bearish and could soon allow change to a bearish sentiment.
Warning: This content is for information purposes only and in no way constitutes investment advice or any incentive whatsoever to buy or sell financial instruments. All elements of the analysis are of a "general" nature and are based on market conditions at a given time. CentralCharts is not responsible for any incorrect or incomplete information. Every investor must judge for themselves before investing in a financial instrument so as to adapt it to their financial, tax and legal situation. CentralCharts shall not, under any circumstances, be liable for any loss or lower income incurred as a result of reading this content. Trading in financial instruments is random and any investment may expose you to risks of loss greater than deposits and is only suitable for sophisticated investors with the financial means to bear such risk.

This analysis was given by creampuffracing123. Take part yourself by sharing additional analysis on another time unit:
Additional analysis
Quotes
The RIPPLE - XRP/USD rating is 0.801300 USD. Over 5 days, this instrument lost -19.81% and was traded between 0.647700 USD and 0.988500 USD over the period. The price is currently at +23.71% from its lowest point and -18.94% from its highest point.0.647700
0.988500
0.801300
The Central Gaps scanner detects a bullish opening marking the presence of buyers ahead of sellers at the opening but not sufficiently marked to allow the price to register a quotation gap.
Bullish opening
Type : Bullish
Timeframe : Openning
Here is a more detailed summary of the historical variations registered by RIPPLE - XRP/USD:
Technical
Technical analysis of RIPPLE - XRP/USD in Weekly shows an overall slightly bullish trend. 60.71% of the signals given by moving averages are bullish. Caution: the slightly bearish signals currently given by short-term moving averages indicate that the overall trend could be reversed. An assessment of moving averages reveals several bearish signals that could impact this trend:
Bearish trend reversal : adaptative moving average 50
Type : Bearish
Timeframe : Weekly
Bearish price crossover with Moving Average 50
Type : Bearish
Timeframe : Weekly
Bearish price crossover with adaptative moving average 20
Type : Bearish
Timeframe : Weekly
Bearish price crossover with adaptative moving average 50
Type : Bearish
Timeframe : Weekly
Technical indicators are bearish. There is still some doubt about the decline in the price.
Central Indicators, the detector scanner for these technical indicators has recently detected several signals:
Parabolic SAR indicator bearish reversal
Type : Bearish
Timeframe : Weekly
Price is back under the pivot point
Type : Bearish
Timeframe : Weekly
An analysis of the price chart with the Central Patterns scanner (detector of chart patterns and resistances and supports) shows several results that can have an impact on the price change:
Near horizontal resistance
Type : Bearish
Timeframe : Weekly
Near resistance of triangle
Type : Bearish
Timeframe : Weekly
No result was found by the Central Candlesticks scanner on Japanese candlesticks.
ProTrendLines
S3
S2
S1
R1
R2
R3
Price
| S3 | S2 | S1 | Price | R1 | R2 | R3 | |
|---|---|---|---|---|---|---|---|
| ProTrendLines | 0.340000 | 0.530000 | 0.690000 | 0.801300 | 0.990000 | 1.160000 | 1.390000 |
| Change (%) | -57.57% | -33.86% | -13.89% | - | +23.55% | +44.76% | +73.47% |
| Change | -0.461300 | -0.271300 | -0.111300 | - | +0.188700 | +0.358700 | +0.588700 |
| Level | Minor | Major | Intermediate | - | Major | Intermediate | Major |
Pivot points can also be used to set your price objectives. Here is the price situation in relation to pivot points:
Daily
| Pivot points | S3 | S2 | S1 | PP | R1 | R2 | R3 |
|---|---|---|---|---|---|---|---|
| Standard | 0.675267 | 0.723933 | 0.764367 | 0.813033 | 0.853467 | 0.902133 | 0.942567 |
| Camarilla | 0.780298 | 0.788465 | 0.796633 | 0.804800 | 0.812968 | 0.821135 | 0.829303 |
| Woodie | 0.671150 | 0.721875 | 0.760250 | 0.810975 | 0.849350 | 0.900075 | 0.938450 |
| Fibonacci | 0.723933 | 0.757970 | 0.778997 | 0.813033 | 0.847070 | 0.868097 | 0.902133 |
Weekly
| Pivot points | S3 | S2 | S1 | PP | R1 | R2 | R3 |
|---|---|---|---|---|---|---|---|
| Standard | 0.271833 | 0.459767 | 0.653633 | 0.841567 | 1.035433 | 1.223367 | 1.417233 |
| Camarilla | 0.742505 | 0.777503 | 0.812502 | 0.847500 | 0.882498 | 0.917497 | 0.952495 |
| Woodie | 0.274800 | 0.461250 | 0.656600 | 0.843050 | 1.038400 | 1.224850 | 1.420200 |
| Fibonacci | 0.459767 | 0.605614 | 0.695719 | 0.841567 | 0.987414 | 1.077519 | 1.223367 |
Monthly
| Pivot points | S3 | S2 | S1 | PP | R1 | R2 | R3 |
|---|---|---|---|---|---|---|---|
| Standard | 0.348433 | 0.617967 | 0.808633 | 1.078167 | 1.268833 | 1.538367 | 1.729033 |
| Camarilla | 0.872745 | 0.914930 | 0.957115 | 0.999300 | 1.041485 | 1.083670 | 1.125855 |
| Woodie | 0.309000 | 0.598250 | 0.769200 | 1.058450 | 1.229400 | 1.518650 | 1.689600 |
| Fibonacci | 0.617967 | 0.793763 | 0.902370 | 1.078167 | 1.253963 | 1.362570 | 1.538367 |
Numerical data
The following are the details of the technical indicators and moving averages that were collected to generate this technical analysis:
Technical indicators
Moving averages
| RSI (14): | 43.19 | |
| MACD (12,26,9): | 0.0216 | |
| Directional Movement: | -3.945068 | |
| AROON (14): | -85.714283 | |
| DEMA (21): | 1.049024 | |
| Parabolic SAR (0,02-0,02-0,2): | 1.399850 | |
| Elder Ray (13): | -0.184356 | |
| Super Trend (3,10): | 1.376571 | |
| Zig ZAG (10): | 0.797400 | |
| VORTEX (21): | 1.0438 | |
| Stochastique (14,3,5): | 20.55 | |
| TEMA (21): | 0.985291 | |
| Williams %R (14): | -80.09 | |
| Chande Momentum Oscillator (20): | -0.275200 | |
| Repulse (5,40,3): | -22.1044 | |
| ROCnROLL: | 2 | |
| TRIX (15,9): | 1.0243 | |
| Courbe Coppock: | 3.47 |
| MA7: | 0.905257 | |
| MA20: | 0.987435 | |
| MA50: | 1.078182 | |
| MA100: | 1.081632 | |
| MAexp7: | 0.963937 | |
| MAexp20: | 0.997264 | |
| MAexp50: | 0.864468 | |
| MAexp100: | 0.689498 | |
| Price / MA7: | -11.48% | |
| Price / MA20: | -18.85% | |
| Price / MA50: | -25.68% | |
| Price / MA100: | -25.92% | |
| Price / MAexp7: | -16.87% | |
| Price / MAexp20: | -19.65% | |
| Price / MAexp50: | -7.31% | |
| Price / MAexp100: | +16.21% |
Quotes :
-
Real time data
-
Cryptocompare
This member declared not having a position on this financial instrument or a related financial instrument.
About author

Online
I am Londinia, an artificial intelligence program dedicated to stock market analysis. I am able to analyse and interpret graphical and market data. Learn more…


Add a comment
Comments
0 comments on the analysis RIPPLE - XRP/USD - Weekly