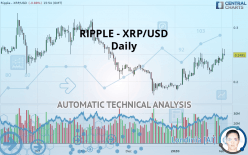
RIPPLE - XRP/USD - Daily - Technical analysis published on 02/03/2020 (GMT)
- Who voted?
- 310
- 0
Click here for a new analysis!
- Timeframe : Daily
- - Analysis generated on
- Status : TARGET REACHED

Summary of the analysis

Additional analysis
Quotes
RIPPLE - XRP/USD rating 0.249100 USD. The price registered an increase of -0.88% on the session and was between 0.247100 USD and 0.259600 USD. This implies that the price is at +0.81% from its lowest and at -4.04% from its highest.A bearish opening was detected by the Central Gaps scanner. Sellers are trying to impose a bearish trend in the very short term.
Bearish opening
Type : Bearish
Timeframe : Openning
A study of price movements over other periods shows the following variations:
Near a new HIGH record (1st january)
Type : Bullish
Timeframe : Weekly
Near a new HIGH record (1 month)
Type : Bullish
Timeframe : Weekly
Technical
Technical analysis of this Daily chart of RIPPLE - XRP/USD indicates that the overall trend is bullish. 71.43% of the signals given by moving averages are bullish. This bullish trend is supported by the strong bullish signals given by short-term moving averages. The Central Indicators market scanner currently does not detect any result that concerns moving averages.
An assessment of technical indicators shows a strong bullish signal.
Caution: the Central Indicators scanner currently detects an excess:
CCI indicator is overbought : over 100
Type : Neutral
Timeframe : Daily
Williams %R indicator is overbought : over -20
Type : Neutral
Timeframe : Daily
Aroon indicator bullish trend
Type : Bullish
Timeframe : Daily
Price is back over the pivot point
Type : Bullish
Timeframe : Daily
Price is back over the pivot point
Type : Bullish
Timeframe : Weekly
Central Patterns, the market scanner focusing on chart patterns, resistances and supports found these results:
Near resistance of triangle
Type : Bearish
Timeframe : Daily
Horizontal resistance is broken
Type : Bullish
Timeframe : Daily
Resistance of channel is broken
Type : Bullish
Timeframe : Daily
No result was found by the Central Candlesticks scanner on Japanese candlesticks.
| S3 | S2 | S1 | Price | R1 | R2 | R3 | |
|---|---|---|---|---|---|---|---|
| ProTrendLines | 0.186967 | 0.218800 | 0.243200 | 0.249100 | 0.261740 | 0.275952 | 0.310400 |
| Change (%) | -24.94% | -12.16% | -2.37% | - | +5.07% | +10.78% | +24.61% |
| Change | -0.062133 | -0.030300 | -0.005900 | - | +0.012640 | +0.026852 | +0.061300 |
| Level | Intermediate | Intermediate | Major | - | Minor | Intermediate | Major |
Pivot points can also be used to set your price objectives. Here is the price situation in relation to pivot points:
| Pivot points | S3 | S2 | S1 | PP | R1 | R2 | R3 |
|---|---|---|---|---|---|---|---|
| Standard | 0.212567 | 0.224233 | 0.237767 | 0.249433 | 0.262967 | 0.274633 | 0.288167 |
| Camarilla | 0.244370 | 0.246680 | 0.248990 | 0.251300 | 0.253610 | 0.255920 | 0.258230 |
| Woodie | 0.213500 | 0.224700 | 0.238700 | 0.249900 | 0.263900 | 0.275100 | 0.289100 |
| Fibonacci | 0.224233 | 0.233860 | 0.239807 | 0.249433 | 0.259060 | 0.265007 | 0.274633 |
| Pivot points | S3 | S2 | S1 | PP | R1 | R2 | R3 |
|---|---|---|---|---|---|---|---|
| Standard | 0.195300 | 0.206600 | 0.223900 | 0.235200 | 0.252500 | 0.263800 | 0.281100 |
| Camarilla | 0.233335 | 0.235957 | 0.238578 | 0.241200 | 0.243822 | 0.246443 | 0.249065 |
| Woodie | 0.198300 | 0.208100 | 0.226900 | 0.236700 | 0.255500 | 0.265300 | 0.284100 |
| Fibonacci | 0.206600 | 0.217525 | 0.224275 | 0.235200 | 0.246125 | 0.252875 | 0.263800 |
| Pivot points | S3 | S2 | S1 | PP | R1 | R2 | R3 |
|---|---|---|---|---|---|---|---|
| Standard | 0.128967 | 0.156533 | 0.197767 | 0.225333 | 0.266567 | 0.294133 | 0.335367 |
| Camarilla | 0.220080 | 0.226387 | 0.232693 | 0.239000 | 0.245307 | 0.251613 | 0.257920 |
| Woodie | 0.135800 | 0.159950 | 0.204600 | 0.228750 | 0.273400 | 0.297550 | 0.342200 |
| Fibonacci | 0.156533 | 0.182815 | 0.199052 | 0.225333 | 0.251615 | 0.267852 | 0.294133 |
Numerical data
The following are the details of the technical indicators and moving averages that were collected to generate this technical analysis:
| RSI (14): | 63.01 | |
| MACD (12,26,9): | 0.0080 | |
| Directional Movement: | 21.283992 | |
| AROON (14): | 64.285712 | |
| DEMA (21): | 0.244225 | |
| Parabolic SAR (0,02-0,02-0,2): | 0.217448 | |
| Elder Ray (13): | 0.015002 | |
| Super Trend (3,10): | 0.214987 | |
| Zig ZAG (10): | 0.249400 | |
| VORTEX (21): | 1.1217 | |
| Stochastique (14,3,5): | 75.93 | |
| TEMA (21): | 0.248163 | |
| Williams %R (14): | -25.74 | |
| Chande Momentum Oscillator (20): | 0.012300 | |
| Repulse (5,40,3): | 1.6529 | |
| ROCnROLL: | 1 | |
| TRIX (15,9): | 0.4908 | |
| Courbe Coppock: | 7.35 |
| MA7: | 0.242657 | |
| MA20: | 0.235675 | |
| MA50: | 0.213676 | |
| MA100: | 0.233034 | |
| MAexp7: | 0.242897 | |
| MAexp20: | 0.234096 | |
| MAexp50: | 0.226601 | |
| MAexp100: | 0.234766 | |
| Price / MA7: | +2.66% | |
| Price / MA20: | +5.70% | |
| Price / MA50: | +16.58% | |
| Price / MA100: | +6.89% | |
| Price / MAexp7: | +2.55% | |
| Price / MAexp20: | +6.41% | |
| Price / MAexp50: | +9.93% | |
| Price / MAexp100: | +6.11% |
About author

Online


Add a comment
Comments
0 comments on the analysis RIPPLE - XRP/USD - Daily