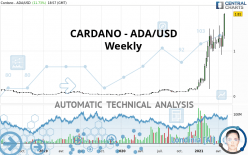
CARDANO - ADA/USD - Weekly - Technical analysis published on 05/09/2021 (GMT)
- 206
- 0
Click here for a new analysis!
- Timeframe : Weekly
- - Analysis generated on
- Status : TARGET REACHED

Summary of the analysis

Additional analysis
Quotes
The CARDANO - ADA/USD rating is 1.81 USD. The price registered an increase of +32.80% over 5 days and has been traded over the last 5 days between 1.28 USD and 1.75 USD. This implies that the 5 day price is +41.91% from its lowest point and +3.48% from its highest point.The Central Gaps scanner detects a bullish opening. A small advantage for buyers in the very short term.
Bullish opening
Type : Bullish
Timeframe : Openning
A study of price movements over other periods shows the following variations:
New HIGH record (1 year)
Type : Bullish
Timeframe : Weekly
New HIGH record (1st january)
Type : Bullish
Timeframe : Weekly
New HIGH record (1 month)
Type : Bullish
Timeframe : Weekly
Technical
A technical analysis in Weekly of this CARDANO - ADA/USD chart shows a strongly bullish trend. 92.86% of the signals given by moving averages are bullish. This strongly bullish trend is supported by the strong bullish signals given by short-term moving averages. The Central Indicators market scanner is currently detecting several bullish signals that could impact this trend:
Bullish price crossover with adaptative moving average 20
Type : Bullish
Timeframe : Weekly
Bullish price crossover with adaptative moving average 50
Type : Bullish
Timeframe : Weekly
In fact, 15 technical indicators on 18 studied are currently bullish. Caution: the Central Indicators scanner currently detects an excess:
RSI indicator is overbought : over 70
Type : Neutral
Timeframe : Weekly
CCI indicator is overbought : over 100
Type : Neutral
Timeframe : Weekly
Williams %R indicator is overbought : over -20
Type : Neutral
Timeframe : Weekly
Pivot points : price is over resistance 1
Type : Neutral
Timeframe : Weekly
No signals are given by Central Patterns, a market scanner specialised in chart patterns, resistances and supports.
The Central Candlesticks scanner which studies Japanese candlesticks did not detect anything.
| S2 | S1 | Price | |
|---|---|---|---|
| ProTrendLines | 0.15 | 1.38 | 1.81 |
| Change (%) | -91.71% | -23.76% | - |
| Change | -1.66 | -0.43 | - |
| Level | Major | Major | - |
Pivot points can also be used to set your price objectives. Here is the price situation in relation to pivot points:
| Pivot points | S3 | S2 | S1 | PP | R1 | R2 | R3 |
|---|---|---|---|---|---|---|---|
| Standard | 1.48 | 1.52 | 1.57 | 1.61 | 1.66 | 1.70 | 1.75 |
| Camarilla | 1.60 | 1.60 | 1.61 | 1.62 | 1.63 | 1.64 | 1.65 |
| Woodie | 1.49 | 1.52 | 1.58 | 1.61 | 1.67 | 1.70 | 1.76 |
| Fibonacci | 1.52 | 1.55 | 1.58 | 1.61 | 1.64 | 1.67 | 1.70 |
| Pivot points | S3 | S2 | S1 | PP | R1 | R2 | R3 |
|---|---|---|---|---|---|---|---|
| Standard | 0.85 | 1.05 | 1.34 | 1.54 | 1.83 | 2.03 | 2.32 |
| Camarilla | 1.49 | 1.53 | 1.58 | 1.62 | 1.67 | 1.71 | 1.76 |
| Woodie | 0.89 | 1.07 | 1.38 | 1.56 | 1.87 | 2.05 | 2.36 |
| Fibonacci | 1.05 | 1.24 | 1.36 | 1.54 | 1.73 | 1.85 | 2.03 |
| Pivot points | S3 | S2 | S1 | PP | R1 | R2 | R3 |
|---|---|---|---|---|---|---|---|
| Standard | 0.34 | 0.62 | 0.99 | 1.27 | 1.64 | 1.92 | 2.29 |
| Camarilla | 1.17 | 1.23 | 1.29 | 1.35 | 1.41 | 1.47 | 1.53 |
| Woodie | 0.38 | 0.64 | 1.03 | 1.29 | 1.68 | 1.94 | 2.33 |
| Fibonacci | 0.62 | 0.87 | 1.03 | 1.27 | 1.52 | 1.68 | 1.92 |
Numerical data
The following is the status of the technical indicators and moving averages at the time of publication of this technical analysis:
| RSI (14): | 78.64 | |
| MACD (12,26,9): | 0.3300 | |
| Directional Movement: | 16.97 | |
| AROON (14): | 78.57 | |
| DEMA (21): | 1.48 | |
| Parabolic SAR (0,02-0,02-0,2): | 0.49 | |
| Elder Ray (13): | 0.46 | |
| Super Trend (3,10): | 0.76 | |
| Zig ZAG (10): | 1.80 | |
| VORTEX (21): | 1.2100 | |
| Stochastique (14,3,5): | 91.83 | |
| TEMA (21): | 1.64 | |
| Williams %R (14): | -1.84 | |
| Chande Momentum Oscillator (20): | 0.69 | |
| Repulse (5,40,3): | 35.0700 | |
| ROCnROLL: | 1 | |
| TRIX (15,9): | 8.8600 | |
| Courbe Coppock: | 510.66 |
| MA7: | 1.55 | |
| MA20: | 1.35 | |
| MA50: | 1.28 | |
| MA100: | 1.12 | |
| MAexp7: | 1.44 | |
| MAexp20: | 1.06 | |
| MAexp50: | 0.64 | |
| MAexp100: | 0.40 | |
| Price / MA7: | +16.77% | |
| Price / MA20: | +34.07% | |
| Price / MA50: | +41.41% | |
| Price / MA100: | +61.61% | |
| Price / MAexp7: | +25.69% | |
| Price / MAexp20: | +70.75% | |
| Price / MAexp50: | +182.81% | |
| Price / MAexp100: | +352.50% |
About author

Online


Add a comment
Comments
0 comments on the analysis CARDANO - ADA/USD - Weekly