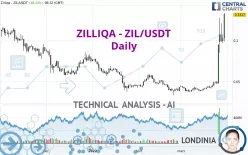
ZILLIQA - ZIL/USDT - Daily - Technical analysis published on 03/30/2022 (GMT)
- 316
- 0
Click here for a new analysis!
- Timeframe : Daily
- - Analysis generated on
- Status : INVALID

Summary of the analysis

Additional analysis
Quotes
The ZILLIQA - ZIL/USDT rating is 0.131700 USDT. The price has increased by +28.24% since the last closing and was traded between 0.098370 USDT and 0.133100 USDT over the period. The price is currently at +33.88% from its lowest and -1.05% from its highest.The Central Gaps scanner detects a bullish opening. A small advantage for buyers in the very short term.
Bullish opening
Type : Bullish
Timeframe : Openning
A study of price movements over other periods shows the following variations:
Near a new HIGH record (1st january)
Type : Bullish
Timeframe : Weekly
Near a new HIGH record (1 month)
Type : Bullish
Timeframe : Weekly
The Central Volumes scanner notes the presence of abnormal volumes:
Abnormal volumes
Timeframe : 5 days
Abnormal volumes
Timeframe : 20 days
Technical
A technical analysis in Daily of this ZILLIQA - ZIL/USDT chart shows a strongly bullish trend. 85.71% of the signals given by moving averages are bullish. The overall trend is supported by the strong bullish signals from short-term moving averages. The Central Indicators market scanner currently does not detect any result that concerns moving averages.
In fact, according to the parameters integrated into the Central Analyzer system, 16 technical indicators out of 18 analysed are currently bullish. Caution: the Central Indicators scanner currently detects an excess:
RSI indicator is overbought : over 80
Type : Neutral
Timeframe : Daily
CCI indicator is overbought : over 100
Type : Neutral
Timeframe : Daily
Williams %R indicator is overbought : over -20
Type : Neutral
Timeframe : Daily
Pivot points : price is over resistance 1
Type : Neutral
Timeframe : Weekly
Pivot points : price is over resistance 3
Type : Neutral
Timeframe : Daily
An analysis of the price chart with the Central Patterns scanner (detector of chart patterns and resistances and supports) shows a result that can have an impact on the price change:
Horizontal resistance is broken
Type : Bullish
Timeframe : Daily
For a small rebound in the very short term, the Central Candlesticks scanner currently notes the presence of this bullish pattern in Japanese candlesticks:
Long white line
Type : Bullish
Timeframe : Daily
| S3 | S2 | S1 | Price | R1 | R2 | |
|---|---|---|---|---|---|---|
| ProTrendLines | 0.091465 | 0.102967 | 0.114500 | 0.131700 | 0.132700 | 0.236200 |
| Change (%) | -30.55% | -21.82% | -13.06% | - | +0.76% | +79.35% |
| Change | -0.040235 | -0.028733 | -0.017200 | - | +0.001000 | +0.104500 |
| Level | Major | Intermediate | Major | - | Intermediate | Major |
Pivot points can also be used to set your price objectives. Here is the price situation in relation to pivot points:
| Pivot points | S3 | S2 | S1 | PP | R1 | R2 | R3 |
|---|---|---|---|---|---|---|---|
| Standard | 0.086250 | 0.091380 | 0.097040 | 0.102170 | 0.107830 | 0.112960 | 0.118620 |
| Camarilla | 0.099733 | 0.100722 | 0.101711 | 0.102700 | 0.103689 | 0.104678 | 0.105667 |
| Woodie | 0.086515 | 0.091513 | 0.097305 | 0.102303 | 0.108095 | 0.113093 | 0.118885 |
| Fibonacci | 0.091380 | 0.095502 | 0.098048 | 0.102170 | 0.106292 | 0.108838 | 0.112960 |
| Pivot points | S3 | S2 | S1 | PP | R1 | R2 | R3 |
|---|---|---|---|---|---|---|---|
| Standard | 0.004690 | 0.022990 | 0.058600 | 0.076900 | 0.112510 | 0.130810 | 0.166420 |
| Camarilla | 0.079385 | 0.084327 | 0.089268 | 0.094210 | 0.099152 | 0.104094 | 0.109035 |
| Woodie | 0.013345 | 0.027318 | 0.067255 | 0.081228 | 0.121165 | 0.135138 | 0.175075 |
| Fibonacci | 0.022990 | 0.043584 | 0.056306 | 0.076900 | 0.097494 | 0.110216 | 0.130810 |
| Pivot points | S3 | S2 | S1 | PP | R1 | R2 | R3 |
|---|---|---|---|---|---|---|---|
| Standard | 0.007493 | 0.020427 | 0.031793 | 0.044727 | 0.056093 | 0.069027 | 0.080393 |
| Camarilla | 0.036478 | 0.038705 | 0.040933 | 0.043160 | 0.045388 | 0.047615 | 0.049843 |
| Woodie | 0.006710 | 0.020035 | 0.031010 | 0.044335 | 0.055310 | 0.068635 | 0.079610 |
| Fibonacci | 0.020427 | 0.029709 | 0.035444 | 0.044727 | 0.054009 | 0.059744 | 0.069027 |
Numerical data
The following are the details of the technical indicators and moving averages that were collected to generate this technical analysis:
| RSI (14): | 86.54 | |
| MACD (12,26,9): | 0.0165 | |
| Directional Movement: | 51.227751 | |
| AROON (14): | 78.571429 | |
| DEMA (21): | 0.086163 | |
| Parabolic SAR (0,02-0,02-0,2): | 0.071134 | |
| Elder Ray (13): | 0.033083 | |
| Super Trend (3,10): | 0.073451 | |
| Zig ZAG (10): | 0.123800 | |
| VORTEX (21): | 1.3075 | |
| Stochastique (14,3,5): | 78.88 | |
| TEMA (21): | 0.101036 | |
| Williams %R (14): | -3.91 | |
| Chande Momentum Oscillator (20): | 0.081530 | |
| Repulse (5,40,3): | 34.5847 | |
| ROCnROLL: | 1 | |
| TRIX (15,9): | 2.4981 | |
| Courbe Coppock: | 243.63 |
| MA7: | 0.089461 | |
| MA20: | 0.058531 | |
| MA50: | 0.049750 | |
| MA100: | 0.054947 | |
| MAexp7: | 0.094519 | |
| MAexp20: | 0.068466 | |
| MAexp50: | 0.056513 | |
| MAexp100: | 0.058333 | |
| Price / MA7: | +47.21% | |
| Price / MA20: | +125.01% | |
| Price / MA50: | +164.72% | |
| Price / MA100: | +139.69% | |
| Price / MAexp7: | +39.34% | |
| Price / MAexp20: | +92.36% | |
| Price / MAexp50: | +133.04% | |
| Price / MAexp100: | +125.77% |
About author

Online


Add a comment
Comments
0 comments on the analysis ZILLIQA - ZIL/USDT - Daily