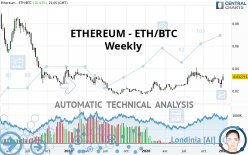
ETHEREUM - ETH/BTC - Weekly - Technical analysis published on 01/04/2021 (GMT)
- 165
- 0
I am delighted to see that my first price objective has been achieved. I hope you've taken advantage of it.
Click here for a new analysis!
Click here for a new analysis!
- Timeframe : Weekly
- - Analysis generated on
- Status : TARGET REACHED

Summary of the analysis
Trends
Court terme:
Bullish
De fond:
Strongly bullish
Technical indicators
56%
17%
28%
My opinion
Bullish above 0.026254 BTC
My targets
0.040100 BTC (+22.58%)
0.040305 BTC (+23.20%)
My analysis
All elements being clearly bullish, it would be possible for traders to trade only long positions (at the time of purchase) on ETHEREUM - ETH/BTC as long as the price remains well above 0.026254 BTC. The buyers” bullish objective is set at 0.040100 BTC. A bullish break in this resistance would boost the bullish momentum. The buyers could then target the resistance located at 0.040305 BTC. If there is any crossing, the next objective would be the resistance located at 0.072170 BTC. Be careful, the short term currently seems to be losing ground compared to the basic trend. Longer time units should be analysed to identify possible overbought items that could be a sign of a possible short-term correction.
Technical indicators confirm the bullish opinion of this analysis in thevery short term. However, be careful of excessive bullish movements. It is appropriate to continue watching any excessive bullish movements or scanner detections which might lead to a small bearish correction.
Force
0
10
5.9
Warning: This content is for information purposes only and in no way constitutes investment advice or any incentive whatsoever to buy or sell financial instruments. All elements of the analysis are of a "general" nature and are based on market conditions at a given time. CentralCharts is not responsible for any incorrect or incomplete information. Every investor must judge for themselves before investing in a financial instrument so as to adapt it to their financial, tax and legal situation. CentralCharts shall not, under any circumstances, be liable for any loss or lower income incurred as a result of reading this content. Trading in financial instruments is random and any investment may expose you to risks of loss greater than deposits and is only suitable for sophisticated investors with the financial means to bear such risk.

This analysis was given by dallas28. Take part yourself by sharing additional analysis on another time unit:
Additional analysis
Quotes
The ETHEREUM - ETH/BTC rating is 0.032714 BTC. The price is up +22.37% over 5 days with the lowest point at 0.023538 BTC and the highest point at 0.026060 BTC. The deviation from the price is +38.98% for the low point and +25.53% for the high point.0.023538
0.026060
0.032714
The Central Gaps scanner detects a bearish opening marking the presence of sellers ahead of buyers at the opening but not sufficiently marked to allow the price to register a quotation gap.
Bearish opening
Type : Bearish
Timeframe : Openning
So that you have an overall view of the price change, here is a table showing the variations over several periods:
Technical
A technical analysis in Weekly of this ETHEREUM - ETH/BTC chart shows a strongly bullish trend. 82.14% of the signals given by moving averages are bullish. The slightly bullish signals given by the short-term moving averages show a weakening of the global trend. The Central Indicators market scanner currently does not detect any result that concerns moving averages.
In fact, 10 technical indicators on 18 studied are currently bullish. Caution: the Central Indicators scanner currently detects an excess:
CCI indicator is oversold : under -100
Type : Neutral
Timeframe : Weekly
Previous candle closed under Bollinger bands
Type : Neutral
Timeframe : Weekly
Williams %R indicator is oversold : under -80
Type : Neutral
Timeframe : Weekly
Williams %R indicator is overbought : over -20
Type : Neutral
Timeframe : Weekly
Pivot points : price is over resistance 3
Type : Neutral
Timeframe : Weekly
An analysis of the price chart with the Central Patterns scanner (detector of chart patterns and resistances and supports) shows several results that can have an impact on the price change:
Near horizontal resistance
Type : Bearish
Timeframe : Weekly
Resistance of channel is broken
Type : Bullish
Timeframe : Weekly
The Central Candlesticks scanner currently notes the presence of this pattern in Japanese candlesticks that could mark the end of the short-term trend currently underway:
Doji
Type : Neutral
Timeframe : Weekly
ProTrendLines
S2
S1
R1
R2
R3
Price
| S2 | S1 | Price | R1 | R2 | R3 | |
|---|---|---|---|---|---|---|
| ProTrendLines | 0.016726 | 0.026254 | 0.032714 | 0.040100 | 0.072170 | 0.084670 |
| Change (%) | -48.87% | -19.75% | - | +22.58% | +120.61% | +158.82% |
| Change | -0.015988 | -0.006460 | - | +0.007386 | +0.039456 | +0.051956 |
| Level | Intermediate | Major | - | Major | Minor | Minor |
To determine price objectives, it is also possible to use the pivot points. Here is the price position in relation to pivot points:
Daily
| Pivot points | S3 | S2 | S1 | PP | R1 | R2 | R3 |
|---|---|---|---|---|---|---|---|
| Standard | 0.017761 | 0.020424 | 0.025024 | 0.027687 | 0.032287 | 0.034950 | 0.039550 |
| Camarilla | 0.027627 | 0.028293 | 0.028958 | 0.029624 | 0.030290 | 0.030956 | 0.031621 |
| Woodie | 0.018730 | 0.020908 | 0.025993 | 0.028171 | 0.033256 | 0.035434 | 0.040519 |
| Fibonacci | 0.020424 | 0.023199 | 0.024913 | 0.027687 | 0.030462 | 0.032176 | 0.034950 |
Weekly
| Pivot points | S3 | S2 | S1 | PP | R1 | R2 | R3 |
|---|---|---|---|---|---|---|---|
| Standard | 0.017082 | 0.019914 | 0.021990 | 0.024822 | 0.026898 | 0.029730 | 0.031806 |
| Camarilla | 0.022715 | 0.023165 | 0.023615 | 0.024065 | 0.024515 | 0.024965 | 0.025415 |
| Woodie | 0.016703 | 0.019725 | 0.021611 | 0.024633 | 0.026519 | 0.029541 | 0.031427 |
| Fibonacci | 0.019914 | 0.021789 | 0.022948 | 0.024822 | 0.026697 | 0.027856 | 0.029730 |
Monthly
| Pivot points | S3 | S2 | S1 | PP | R1 | R2 | R3 |
|---|---|---|---|---|---|---|---|
| Standard | 0.011940 | 0.017343 | 0.021395 | 0.026798 | 0.030850 | 0.036253 | 0.040305 |
| Camarilla | 0.022846 | 0.023713 | 0.024579 | 0.025446 | 0.026313 | 0.027179 | 0.028046 |
| Woodie | 0.011264 | 0.017005 | 0.020719 | 0.026460 | 0.030174 | 0.035915 | 0.039629 |
| Fibonacci | 0.017343 | 0.020955 | 0.023187 | 0.026798 | 0.030410 | 0.032642 | 0.036253 |
Numerical data
The following is the status of the technical indicators and moving averages at the time of publication of this technical analysis:
Technical indicators
Moving averages
| RSI (14): | 57.09 | |
| MACD (12,26,9): | -0.0002 | |
| Directional Movement: | 5.763863 | |
| AROON (14): | 7.142860 | |
| DEMA (21): | 0.029658 | |
| Parabolic SAR (0,02-0,02-0,2): | 0.022747 | |
| Elder Ray (13): | -0.000173 | |
| Super Trend (3,10): | 0.035250 | |
| Zig ZAG (10): | 0.032918 | |
| VORTEX (21): | 0.8815 | |
| Stochastique (14,3,5): | 32.26 | |
| TEMA (21): | 0.028295 | |
| Williams %R (14): | -16.21 | |
| Chande Momentum Oscillator (20): | 0.000581 | |
| Repulse (5,40,3): | 16.2913 | |
| ROCnROLL: | 1 | |
| TRIX (15,9): | 0.2691 | |
| Courbe Coppock: | 30.40 |
| MA7: | 0.027075 | |
| MA20: | 0.026880 | |
| MA50: | 0.028866 | |
| MA100: | 0.029904 | |
| MAexp7: | 0.028619 | |
| MAexp20: | 0.029420 | |
| MAexp50: | 0.028487 | |
| MAexp100: | 0.029870 | |
| Price / MA7: | +20.83% | |
| Price / MA20: | +21.70% | |
| Price / MA50: | +13.33% | |
| Price / MA100: | +9.40% | |
| Price / MAexp7: | +14.30% | |
| Price / MAexp20: | +11.19% | |
| Price / MAexp50: | +14.83% | |
| Price / MAexp100: | +9.51% |
Quotes :
2021-01-04 21:05:41
-
Real time data
-
Cryptocompare
This member declared not having a position on this financial instrument or a related financial instrument.
About author

Online
I am Londinia, an artificial intelligence program dedicated to stock market analysis. I am able to analyse and interpret graphical and market data. Learn more…


Add a comment
Comments
0 comments on the analysis ETHEREUM - ETH/BTC - Weekly