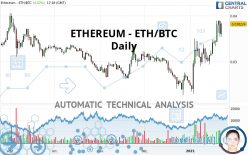
ETHEREUM - ETH/BTC - Daily - Technical analysis published on 01/22/2021 (GMT)
- 194
- 0
Click here for a new analysis!
- Timeframe : Daily
- - Analysis generated on
- Status : TARGET REACHED

Summary of the analysis

Additional analysis
Quotes
The ETHEREUM - ETH/BTC price is 0.038221 BTC. The price has increased by +6.01% since the last closing with the lowest point at 0.035481 BTC and the highest point at 0.038445 BTC. The deviation from the price is +7.72% for the low point and -0.58% for the high point.A bearish opening was detected by the Central Gaps scanner. Sellers are trying to impose a bearish trend in the very short term.
Bearish opening
Type : Bearish
Timeframe : Openning
Here is a more detailed summary of the historical variations registered by ETHEREUM - ETH/BTC:
Near a new HIGH record (1st january)
Type : Bullish
Timeframe : Weekly
Near a new HIGH record (1 month)
Type : Bullish
Timeframe : Weekly
The Central Volumes scanner detects abnormal volumes on the asset:
Abnormal volumes
Timeframe : 20 days
Technical
Technical analysis of ETHEREUM - ETH/BTC in Daily shows a strongly overall bullish trend. The signals given by the moving averages are 92.86% bullish. This strong bullish trend is confirmed by the strong signals currently being given by short-term moving averages. The Central Indicators scanner detects a bullish signal on moving averages that could impact this trend:
Moving Average bullish crossovers : MA50 & MA100
Type : Bullish
Timeframe : Daily
The probability of a further increase is high given the direction of the technical indicators.
But beware of excesses. The Central Indicators scanner currently detects this:
CCI indicator is overbought : over 100
Type : Neutral
Timeframe : Daily
Previous candle closed over Bollinger bands
Type : Neutral
Timeframe : Daily
CCI indicator: bearish divergence
Type : Bearish
Timeframe : Daily
MACD indicator: bearish divergence
Type : Bearish
Timeframe : Daily
Williams %R indicator is overbought : over -20
Type : Neutral
Timeframe : Daily
Pivot points : price is over resistance 1
Type : Neutral
Timeframe : Daily
Pivot points : price is over resistance 1
Type : Neutral
Timeframe : Weekly
Price is back under the pivot point
Type : Bearish
Timeframe : Daily
An analysis of the price chart with the Central Patterns scanner (detector of chart patterns and resistances and supports) shows a result that can have an impact on the price change:
Resistance of channel is broken
Type : Bullish
Timeframe : Daily
No result was found by the Central Candlesticks scanner on Japanese candlesticks.
| S3 | S2 | S1 | Price | R1 | R2 | R3 | |
|---|---|---|---|---|---|---|---|
| ProTrendLines | 0.026254 | 0.033451 | 0.037212 | 0.038221 | 0.040100 | 0.072170 | 0.084670 |
| Change (%) | -31.31% | -12.48% | -2.64% | - | +4.92% | +88.82% | +121.53% |
| Change | -0.011967 | -0.004770 | -0.001009 | - | +0.001879 | +0.033949 | +0.046449 |
| Level | Major | Major | Intermediate | - | Major | Minor | Minor |
Pivot points can also be used to set your price objectives. Here is the price situation in relation to pivot points:
| Pivot points | S3 | S2 | S1 | PP | R1 | R2 | R3 |
|---|---|---|---|---|---|---|---|
| Standard | 0.032049 | 0.034036 | 0.035048 | 0.037035 | 0.038047 | 0.040034 | 0.041046 |
| Camarilla | 0.035234 | 0.035509 | 0.035784 | 0.036059 | 0.036334 | 0.036609 | 0.036884 |
| Woodie | 0.031561 | 0.033792 | 0.034560 | 0.036791 | 0.037559 | 0.039790 | 0.040558 |
| Fibonacci | 0.034036 | 0.035182 | 0.035890 | 0.037035 | 0.038181 | 0.038889 | 0.040034 |
| Pivot points | S3 | S2 | S1 | PP | R1 | R2 | R3 |
|---|---|---|---|---|---|---|---|
| Standard | 0.025348 | 0.027386 | 0.030745 | 0.032783 | 0.036142 | 0.038180 | 0.041539 |
| Camarilla | 0.032620 | 0.033115 | 0.033609 | 0.034104 | 0.034599 | 0.035094 | 0.035588 |
| Woodie | 0.026009 | 0.027716 | 0.031406 | 0.033113 | 0.036803 | 0.038510 | 0.042200 |
| Fibonacci | 0.027386 | 0.029448 | 0.030721 | 0.032783 | 0.034845 | 0.036118 | 0.038180 |
| Pivot points | S3 | S2 | S1 | PP | R1 | R2 | R3 |
|---|---|---|---|---|---|---|---|
| Standard | 0.011940 | 0.017343 | 0.021395 | 0.026798 | 0.030850 | 0.036253 | 0.040305 |
| Camarilla | 0.022846 | 0.023713 | 0.024579 | 0.025446 | 0.026313 | 0.027179 | 0.028046 |
| Woodie | 0.011264 | 0.017005 | 0.020719 | 0.026460 | 0.030174 | 0.035915 | 0.039629 |
| Fibonacci | 0.017343 | 0.020955 | 0.023187 | 0.026798 | 0.030410 | 0.032642 | 0.036253 |
Numerical data
The following is the status of technical indicators and moving averages registered at the time this technical analysis was created:
| RSI (14): | 66.11 | |
| MACD (12,26,9): | 0.0023 | |
| Directional Movement: | 14.503191 | |
| AROON (14): | 92.857140 | |
| DEMA (21): | 0.035995 | |
| Parabolic SAR (0,02-0,02-0,2): | 0.028219 | |
| Elder Ray (13): | 0.002279 | |
| Super Trend (3,10): | 0.030510 | |
| Zig ZAG (10): | 0.038266 | |
| VORTEX (21): | 1.1808 | |
| Stochastique (14,3,5): | 86.91 | |
| TEMA (21): | 0.037683 | |
| Williams %R (14): | -8.50 | |
| Chande Momentum Oscillator (20): | 0.005337 | |
| Repulse (5,40,3): | 8.7108 | |
| ROCnROLL: | 1 | |
| TRIX (15,9): | 0.8095 | |
| Courbe Coppock: | 35.77 |
| MA7: | 0.036308 | |
| MA20: | 0.033104 | |
| MA50: | 0.030090 | |
| MA100: | 0.029976 | |
| MAexp7: | 0.036249 | |
| MAexp20: | 0.033335 | |
| MAexp50: | 0.031195 | |
| MAexp100: | 0.030632 | |
| Price / MA7: | +5.27% | |
| Price / MA20: | +15.46% | |
| Price / MA50: | +27.02% | |
| Price / MA100: | +27.51% | |
| Price / MAexp7: | +5.44% | |
| Price / MAexp20: | +14.66% | |
| Price / MAexp50: | +22.52% | |
| Price / MAexp100: | +24.77% |
About author

Online


Add a comment
Comments
0 comments on the analysis ETHEREUM - ETH/BTC - Daily