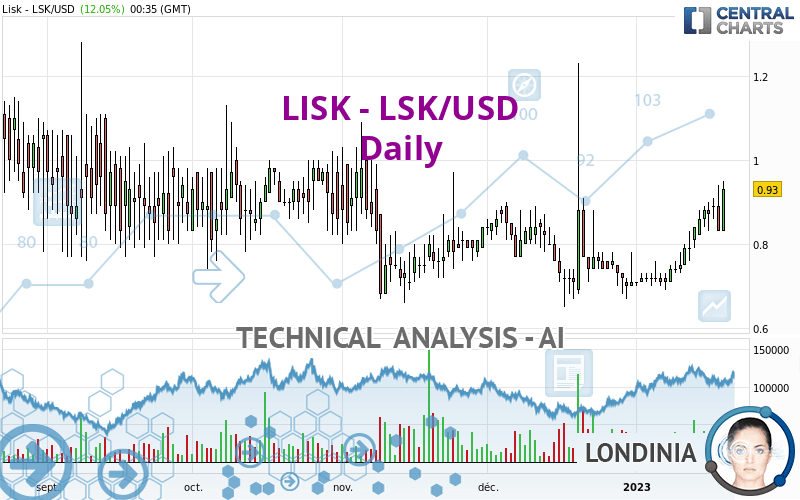
LISK - LSK/USD - Daily - Technical analysis published on 01/19/2023 (GMT)
- 138
- 0
Click here for a new analysis!
- Timeframe : Daily
- - Analysis generated on
- Status : TARGET REACHED

Summary of the analysis

Additional analysis
Quotes
The LISK - LSK/USD price is 0.930000 USD. On the day, this instrument gained +12.05% with the lowest point at 0.830000 USD and the highest point at 0.950000 USD. The deviation from the price is +12.05% for the low point and -2.11% for the high point.So that you have an overall view of the price change, here is a table showing the variations over several periods:
New HIGH record (1st january)
Type : Bullish
Timeframe : Weekly
Near a new HIGH record (1st january)
Type : Bullish
Timeframe : Weekly
Technical
A technical analysis in Daily of this LISK - LSK/USD chart shows a bullish trend. The signals returned by the moving averages are 75.00% bullish. This bullish trend is reinforced by the strong signals currently being given by short-term moving averages. The Central Indicators market scanner is currently detecting several bullish signals that could impact this trend:
Bullish price crossover with adaptative moving average 20
Type : Bullish
Timeframe : Daily
Bullish price crossover with adaptative moving average 50
Type : Bullish
Timeframe : Daily
Bullish price crossover with adaptative moving average 100
Type : Bullish
Timeframe : Daily
In fact, 16 technical indicators on 18 studied are currently positioned bullish. Caution: the Central Indicators scanner currently detects an excess:
CCI indicator is overbought : over 100
Type : Neutral
Timeframe : Daily
Williams %R indicator is overbought : over -20
Type : Neutral
Timeframe : Daily
Pivot points : price is over resistance 1
Type : Neutral
Timeframe : Daily
Pivot points : price is over resistance 1
Type : Neutral
Timeframe : Weekly
An analysis of the price chart with the Central Patterns scanner (detector of chart patterns and resistances and supports) shows a result that can have an impact on the price change:
Support of triangle is broken
Type : Bearish
Timeframe : Daily
The Central Candlesticks scanner which studies Japanese candlesticks did not detect anything.
| S3 | S2 | S1 | Price | R1 | R2 | R3 | |
|---|---|---|---|---|---|---|---|
| ProTrendLines | 0.710000 | 0.810000 | 0.880000 | 0.930000 | 0.991765 | 1.140000 | 1.260000 |
| Change (%) | -23.66% | -12.90% | -5.38% | - | +6.64% | +22.58% | +35.48% |
| Change | -0.220000 | -0.120000 | -0.050000 | - | +0.061765 | +0.210000 | +0.330000 |
| Level | Intermediate | Minor | Intermediate | - | Intermediate | Minor | Minor |
Attention could also be paid to pivot points to set price objectives:
| Pivot points | S3 | S2 | S1 | PP | R1 | R2 | R3 |
|---|---|---|---|---|---|---|---|
| Standard | 0.683333 | 0.756667 | 0.793333 | 0.866667 | 0.903333 | 0.976667 | 1.013333 |
| Camarilla | 0.799750 | 0.809833 | 0.819917 | 0.830000 | 0.840083 | 0.850167 | 0.860250 |
| Woodie | 0.665000 | 0.747500 | 0.775000 | 0.857500 | 0.885000 | 0.967500 | 0.995000 |
| Fibonacci | 0.756667 | 0.798687 | 0.824647 | 0.866667 | 0.908687 | 0.934647 | 0.976667 |
| Pivot points | S3 | S2 | S1 | PP | R1 | R2 | R3 |
|---|---|---|---|---|---|---|---|
| Standard | 0.583333 | 0.646667 | 0.753333 | 0.816667 | 0.923333 | 0.986667 | 1.093333 |
| Camarilla | 0.813250 | 0.828833 | 0.844417 | 0.860000 | 0.875583 | 0.891167 | 0.906750 |
| Woodie | 0.605000 | 0.657500 | 0.775000 | 0.827500 | 0.945000 | 0.997500 | 1.115000 |
| Fibonacci | 0.646667 | 0.711607 | 0.751727 | 0.816667 | 0.881607 | 0.921727 | 0.986667 |
| Pivot points | S3 | S2 | S1 | PP | R1 | R2 | R3 |
|---|---|---|---|---|---|---|---|
| Standard | -0.083333 | 0.283333 | 0.496667 | 0.863333 | 1.076667 | 1.443333 | 1.656667 |
| Camarilla | 0.550500 | 0.603667 | 0.656833 | 0.710000 | 0.763167 | 0.816333 | 0.869500 |
| Woodie | -0.160000 | 0.245000 | 0.420000 | 0.825000 | 1.000000 | 1.405000 | 1.580000 |
| Fibonacci | 0.283333 | 0.504893 | 0.641773 | 0.863333 | 1.084893 | 1.221773 | 1.443333 |
Numerical data
The following are the details of the technical indicators and moving averages that were collected to generate this technical analysis:
| RSI (14): | 63.79 | |
| MACD (12,26,9): | 0.0320 | |
| Directional Movement: | 23.634137 | |
| AROON (14): | 78.571429 | |
| DEMA (21): | 0.842933 | |
| Parabolic SAR (0,02-0,02-0,2): | 0.735694 | |
| Elder Ray (13): | 0.051667 | |
| Super Trend (3,10): | 0.723503 | |
| Zig ZAG (10): | 0.930000 | |
| VORTEX (21): | 1.1389 | |
| Stochastique (14,3,5): | 82.30 | |
| TEMA (21): | 0.884658 | |
| Williams %R (14): | -7.69 | |
| Chande Momentum Oscillator (20): | 0.220000 | |
| Repulse (5,40,3): | 6.1004 | |
| ROCnROLL: | 1 | |
| TRIX (15,9): | 0.3089 | |
| Courbe Coppock: | 39.61 |
| MA7: | 0.868571 | |
| MA20: | 0.777500 | |
| MA50: | 0.782800 | |
| MA100: | 0.814700 | |
| MAexp7: | 0.863280 | |
| MAexp20: | 0.804194 | |
| MAexp50: | 0.791267 | |
| MAexp100: | 0.822078 | |
| Price / MA7: | +7.07% | |
| Price / MA20: | +19.61% | |
| Price / MA50: | +18.80% | |
| Price / MA100: | +14.15% | |
| Price / MAexp7: | +7.73% | |
| Price / MAexp20: | +15.64% | |
| Price / MAexp50: | +17.53% | |
| Price / MAexp100: | +13.13% |
About author
Online


Add a comment
Comments
0 comments on the analysis LISK - LSK/USD - Daily