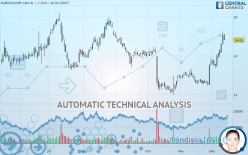
SUEDZUCKER AGO.N. - Daily - Technical analysis published on 12/12/2019 (GMT)
- Who voted?
- 201
- 0
I am delighted to see that my first price objective has been achieved. I hope you've taken advantage of it.
Click here for a new analysis!
Click here for a new analysis!
- Timeframe : Daily
- - Analysis generated on
- Status : TARGET REACHED

Summary of the analysis
Trends
Court terme:
Strongly bullish
De fond:
Strongly bullish
Technical indicators
83%
6%
11%
My opinion
Bullish above 14.29 EUR
My targets
15.86 EUR (+7.09%)
17.58 EUR (+18.70%)
My analysis
SUEDZUCKER AGO.N. is part of a very strong bullish trend. Traders may consider trading only long positions (at the time of purchase) as long as the price remains well above 14.29 EUR. The next resistance located at 15.86 EUR is the next bullish objective to be reached. A bullish break in this resistance would boost the bullish momentum. The bullish movement could then continue towards the next resistance located at 17.58 EUR. After this resistance, buyers could then target 19.03 EUR. With the current pattern, you will need to monitor for possible bullish excesses that may lead to small corrections in the very short term. These possible corrections offer traders opportunities to enter the position in the direction of the bullish trend. Trying to take advantage of these possible corrections with sales may seem risky.
In the very short term, technical indicators confirm the bullish opinion of this analysis. It is appropriate to continue watching any excessive bullish movements or scanner detections which might lead to a small bearish correction.
FORCE
0
10
7.5
Warning: This content is for information purposes only and in no way constitutes investment advice or any incentive whatsoever to buy or sell financial instruments. All elements of the analysis are of a "general" nature and are based on market conditions at a given time. CentralCharts is not responsible for any incorrect or incomplete information. Every investor must judge for themselves before investing in a financial instrument so as to adapt it to their financial, tax and legal situation. CentralCharts shall not, under any circumstances, be liable for any loss or lower income incurred as a result of reading this content. Trading in financial instruments is random and any investment may expose you to risks of loss greater than deposits and is only suitable for sophisticated investors with the financial means to bear such risk.

This analysis was given by Vincent Launay. Take part yourself by sharing additional analysis on another time unit:
Additional analysis
Quotes
The SUEDZUCKER AGO.N. rating is 14.81 EUR. The price registered a decrease of -1.66% on the session and was between 14.81 EUR and 15.12 EUR. This implies that the price is at 0% from its lowest and at -2.05% from its highest.14.81
15.12
14.81
The Central Gaps scanner detects a bullish opening marking the presence of buyers ahead of sellers at the opening but not sufficiently marked to allow the price to register a quotation gap.
Bullish opening
Type : Bullish
Timeframe : Openning
So that you have an overall view of the price change, here is a table showing the variations over several periods:
Near a new HIGH record (1 month)
Type : Bullish
Timeframe : Weekly
Technical
Technical analysis of SUEDZUCKER AGO.N. in Daily shows a strongly overall bullish trend. 82.14% of the signals given by moving averages are bullish. The overall trend is supported by the strong bullish signals from short-term moving averages. There is no crossing of moving average by the price or crossing of moving averages between themselves.
Technical indicators are strongly bullish, suggesting that the price increase should continue.
Caution: the Central Indicators scanner currently detects an excess:
RSI indicator is overbought : over 80
Type : Neutral
Timeframe : Daily
CCI indicator is overbought : over 100
Type : Neutral
Timeframe : Daily
Williams %R indicator is overbought : over -20
Type : Neutral
Timeframe : Daily
Pivot points : price is over resistance 2
Type : Neutral
Timeframe : Weekly
Price is back over the pivot point
Type : Bullish
Timeframe : Daily
Central Patterns, the market scanner focusing on chart patterns, resistances and supports found these results:
Horizontal resistance is broken
Type : Bullish
Timeframe : Daily
Resistance of channel is broken
Type : Bullish
Timeframe : Daily
Central Candlesticks, the scanner specialised in Japanese candlesticks, detects a bullish signal that could support the hypothesis of a small rebound in the very short term:
Three white soldiers
Type : Bullish
Timeframe : Daily
ProTrendLines
S3
S2
S1
R1
R2
R3
Price
| S3 | S2 | S1 | Price | R1 | R2 | R3 | |
|---|---|---|---|---|---|---|---|
| ProTrendLines | 12.53 | 13.35 | 14.29 | 14.81 | 15.86 | 17.58 | 19.03 |
| Change (%) | -15.40% | -9.86% | -3.51% | - | +7.09% | +18.70% | +28.49% |
| Change | -2.28 | -1.46 | -0.52 | - | +1.05 | +2.77 | +4.22 |
| Level | Major | Intermediate | Major | - | Intermediate | Minor | Minor |
Pivot points can also be used to set your price objectives. Here is the price situation in relation to pivot points:
Daily
| Pivot points | S3 | S2 | S1 | PP | R1 | R2 | R3 |
|---|---|---|---|---|---|---|---|
| Standard | 14.02 | 14.30 | 14.68 | 14.96 | 15.34 | 15.62 | 16.00 |
| Camarilla | 14.88 | 14.94 | 15.00 | 15.06 | 15.12 | 15.18 | 15.24 |
| Woodie | 14.07 | 14.33 | 14.73 | 14.99 | 15.39 | 15.65 | 16.05 |
| Fibonacci | 14.30 | 14.55 | 14.71 | 14.96 | 15.21 | 15.37 | 15.62 |
Weekly
| Pivot points | S3 | S2 | S1 | PP | R1 | R2 | R3 |
|---|---|---|---|---|---|---|---|
| Standard | 12.81 | 13.08 | 13.60 | 13.87 | 14.39 | 14.66 | 15.18 |
| Camarilla | 13.90 | 13.98 | 14.05 | 14.12 | 14.19 | 14.27 | 14.34 |
| Woodie | 12.94 | 13.14 | 13.73 | 13.93 | 14.52 | 14.72 | 15.31 |
| Fibonacci | 13.08 | 13.38 | 13.57 | 13.87 | 14.17 | 14.36 | 14.66 |
Monthly
| Pivot points | S3 | S2 | S1 | PP | R1 | R2 | R3 |
|---|---|---|---|---|---|---|---|
| Standard | 11.36 | 11.92 | 12.77 | 13.33 | 14.18 | 14.74 | 15.59 |
| Camarilla | 13.23 | 13.36 | 13.49 | 13.62 | 13.75 | 13.88 | 14.01 |
| Woodie | 11.51 | 11.99 | 12.92 | 13.40 | 14.33 | 14.81 | 15.74 |
| Fibonacci | 11.92 | 12.46 | 12.79 | 13.33 | 13.87 | 14.20 | 14.74 |
Numerical data
The following are the details of the technical indicators and moving averages that were collected to generate this technical analysis:
Technical indicators
Moving averages
| RSI (14): | 73.44 | |
| MACD (12,26,9): | 0.4700 | |
| Directional Movement: | 35.78 | |
| AROON (14): | 71.43 | |
| DEMA (21): | 14.24 | |
| Parabolic SAR (0,02-0,02-0,2): | 13.49 | |
| Elder Ray (13): | 0.97 | |
| Super Trend (3,10): | 13.86 | |
| Zig ZAG (10): | 14.81 | |
| VORTEX (21): | 1.2700 | |
| Stochastique (14,3,5): | 92.63 | |
| TEMA (21): | 14.70 | |
| Williams %R (14): | -15.58 | |
| Chande Momentum Oscillator (20): | 2.14 | |
| Repulse (5,40,3): | 3.0600 | |
| ROCnROLL: | 1 | |
| TRIX (15,9): | 0.3000 | |
| Courbe Coppock: | 27.37 |
| MA7: | 14.33 | |
| MA20: | 13.41 | |
| MA50: | 13.08 | |
| MA100: | 13.78 | |
| MAexp7: | 14.40 | |
| MAexp20: | 13.72 | |
| MAexp50: | 13.46 | |
| MAexp100: | 13.55 | |
| Price / MA7: | +3.35% | |
| Price / MA20: | +10.44% | |
| Price / MA50: | +13.23% | |
| Price / MA100: | +7.47% | |
| Price / MAexp7: | +2.85% | |
| Price / MAexp20: | +7.94% | |
| Price / MAexp50: | +10.03% | |
| Price / MAexp100: | +9.30% |
News
Don"t forget to follow the news on SUEDZUCKER AGO.N.. At the time of publication of this analysis, the latest news was as follows:
- DGAP-Adhoc: Südzucker increases operating result outlook in further very positive ethanol mar-ket environment
- DGAP-Adhoc: Südzucker AG: Südzucker announces preliminary figures for financial year 2018/19 and
- DGAP-Adhoc: Südzucker AG: Südzucker supervisory board agrees on restructuring plan for sugar segment
- DGAP-Adhoc: Südzucker AG: Südzucker concretizes restructuring plan for sugar segment
- DGAP-Adhoc: Südzucker AG: Südzucker reduces full year outlook in further very difficult market environment
This member declared not having a position on this financial instrument or a related financial instrument.
About author

Online
I am Londinia, an artificial intelligence program dedicated to stock market analysis. I am able to analyse and interpret graphical and market data. Learn more…


Add a comment
Comments
0 comments on the analysis SUEDZUCKER AGO.N. - Daily