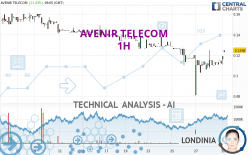
AVENIR TELECOM - 1H - Technical analysis published on 10/31/2023 (GMT)
- 95
- 0
Click here for a new analysis!
- Timeframe : 1H
- - Analysis generated on
- Status : TARGET REACHED

Summary of the analysis

Additional analysis
Quotes
AVENIR TELECOM rating 0.1230 EUR. The price has increased by +9.82% since the last closing with the lowest point at 0.1110 EUR and the highest point at 0.1230 EUR. The deviation from the price is +10.81% for the low point and 0% for the high point.The Central Gaps scanner detects a bullish opening. A small advantage for buyers in the very short term.
Bullish opening
Type : Bullish
Timeframe : Openning
Here is a more detailed summary of the historical variations registered by AVENIR TELECOM:
Technical
Technical analysis of this 1H chart of AVENIR TELECOM indicates that the overall trend is slightly bearish. 57.14% of the signals given by moving averages are bearish. Caution: the strong bullish signals currently being given by short-term moving averages could quickly lead to a reversal of the trend. The Central Indicators scanner detects bullish signals on moving averages that could impact this trend:
Bullish trend reversal : Moving Average 20
Type : Bullish
Timeframe : 1 hour
Bullish price crossover with Moving Average 50
Type : Bullish
Timeframe : 1 hour
Bullish price crossover with adaptative moving average 50
Type : Bullish
Timeframe : 1 hour
In fact, according to the parameters integrated into the Central Analyzer system, 12 technical indicators out of 18 analysed are currently bullish. Caution: the Central Indicators scanner currently detects an excess:
CCI indicator is overbought : over 100
Type : Neutral
Timeframe : 1 hour
Pivot points : price is over resistance 1
Type : Neutral
Timeframe : 1 hour
RSI indicator is back over 50
Type : Bullish
Timeframe : 1 hour
SuperTrend indicator bullish reversal
Type : Bullish
Timeframe : 1 hour
Price is back over the pivot point
Type : Bullish
Timeframe : Weekly
Williams %R indicator is back over -50
Type : Bullish
Timeframe : 1 hour
No signals are given by Central Patterns, a market scanner specialised in chart patterns, resistances and supports.
From the Japanese candlestick perspective, the Central Candlesticks scanner notes the presence of these results that could impact the short-term trend:
Bearish doji star
Type : Bearish
Timeframe : 1 hour
Doji
Type : Neutral
Timeframe : 1 hour
| S3 | S2 | S1 | Price | R1 | R2 | R3 | |
|---|---|---|---|---|---|---|---|
| ProTrendLines | 0.0810 | 0.1006 | 0.1100 | 0.1230 | 0.1255 | 0.1378 | 0.1496 |
| Change (%) | -34.15% | -18.21% | -10.57% | - | +2.03% | +12.03% | +21.63% |
| Change | -0.0420 | -0.0224 | -0.0130 | - | +0.0025 | +0.0148 | +0.0266 |
| Level | Intermediate | Intermediate | Minor | - | Minor | Minor | Intermediate |
To determine price objectives, it is also possible to use the pivot points. Here is the price position in relation to pivot points:
| Pivot points | S3 | S2 | S1 | PP | R1 | R2 | R3 |
|---|---|---|---|---|---|---|---|
| Standard | 0.0863 | 0.0967 | 0.1043 | 0.1147 | 0.1223 | 0.1327 | 0.1403 |
| Camarilla | 0.1071 | 0.1087 | 0.1104 | 0.1120 | 0.1137 | 0.1153 | 0.1170 |
| Woodie | 0.0850 | 0.0960 | 0.1030 | 0.1140 | 0.1210 | 0.1320 | 0.1390 |
| Fibonacci | 0.0967 | 0.1035 | 0.1078 | 0.1147 | 0.1215 | 0.1258 | 0.1327 |
| Pivot points | S3 | S2 | S1 | PP | R1 | R2 | R3 |
|---|---|---|---|---|---|---|---|
| Standard | 0.0258 | 0.0534 | 0.0826 | 0.1102 | 0.1394 | 0.1670 | 0.1962 |
| Camarilla | 0.0962 | 0.1014 | 0.1066 | 0.1118 | 0.1170 | 0.1222 | 0.1274 |
| Woodie | 0.0266 | 0.0538 | 0.0834 | 0.1106 | 0.1402 | 0.1674 | 0.1970 |
| Fibonacci | 0.0534 | 0.0751 | 0.0885 | 0.1102 | 0.1319 | 0.1453 | 0.1670 |
| Pivot points | S3 | S2 | S1 | PP | R1 | R2 | R3 |
|---|---|---|---|---|---|---|---|
| Standard | 0.1250 | 0.1420 | 0.1526 | 0.1696 | 0.1802 | 0.1972 | 0.2078 |
| Camarilla | 0.1556 | 0.1581 | 0.1607 | 0.1632 | 0.1657 | 0.1683 | 0.1708 |
| Woodie | 0.1218 | 0.1404 | 0.1494 | 0.1680 | 0.1770 | 0.1956 | 0.2046 |
| Fibonacci | 0.1420 | 0.1525 | 0.1591 | 0.1696 | 0.1801 | 0.1867 | 0.1972 |
Numerical data
The following are the details of the technical indicators and moving averages that were collected to generate this technical analysis:
| RSI (14): | 59.29 | |
| MACD (12,26,9): | -0.0008 | |
| Directional Movement: | -3.1920 | |
| AROON (14): | 14.2857 | |
| DEMA (21): | 0.1131 | |
| Parabolic SAR (0,02-0,02-0,2): | 0.0975 | |
| Elder Ray (13): | 0.0080 | |
| Super Trend (3,10): | 0.1091 | |
| Zig ZAG (10): | 0.1230 | |
| VORTEX (21): | 0.9223 | |
| Stochastique (14,3,5): | 63.16 | |
| TEMA (21): | 0.1156 | |
| Williams %R (14): | -10.53 | |
| Chande Momentum Oscillator (20): | 0.0130 | |
| Repulse (5,40,3): | 2.4946 | |
| ROCnROLL: | 1 | |
| TRIX (15,9): | -0.3171 | |
| Courbe Coppock: | 7.87 |
| MA7: | 0.1219 | |
| MA20: | 0.1367 | |
| MA50: | 0.1602 | |
| MA100: | 0.1744 | |
| MAexp7: | 0.1163 | |
| MAexp20: | 0.1151 | |
| MAexp50: | 0.1201 | |
| MAexp100: | 0.1284 | |
| Price / MA7: | +0.90% | |
| Price / MA20: | -10.02% | |
| Price / MA50: | -23.22% | |
| Price / MA100: | -29.47% | |
| Price / MAexp7: | +5.76% | |
| Price / MAexp20: | +6.86% | |
| Price / MAexp50: | +2.41% | |
| Price / MAexp100: | -4.21% |
About author
Online


Add a comment
Comments
0 comments on the analysis AVENIR TELECOM - 1H