TWITTER INC. - Daily - Technical analysis published on 08/27/2020 (GMT)
- Who voted?
- 237
- 0
I am delighted to see that my first price objective has been achieved. I hope you've taken advantage of it.
Click here for a new analysis!
Click here for a new analysis!
- Timeframe : Daily
- - Analysis generated on
- Status : TARGET REACHED

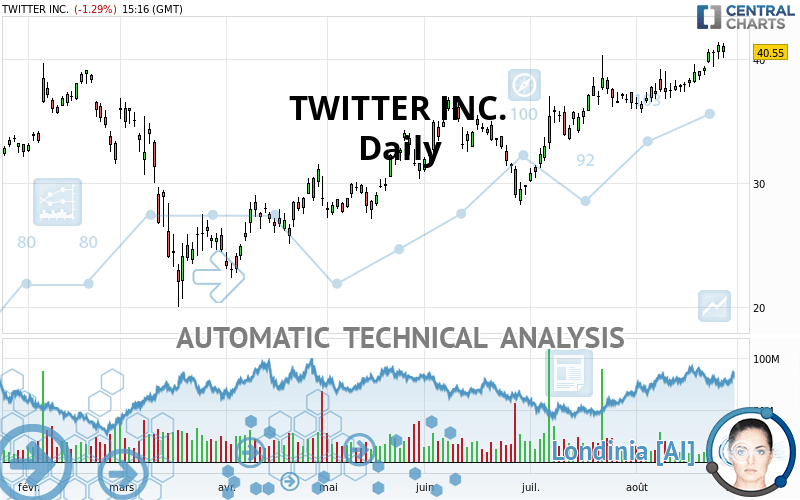
TWITTER INC. Chart
Summary of the analysis
Trends
Court terme:
Strongly bullish
De fond:
Strongly bullish
Technical indicators
78%
6%
17%
My opinion
Bullish above 38.43 USD
My targets
45.77 USD (+12.87%)
46.76 USD (+15.31%)
My analysis
TWITTER INC. is part of a very strong bullish trend. Traders may consider trading only long positions (at the time of purchase) as long as the price remains well above 38.43 USD. The next resistance located at 45.77 USD is the next bullish objective to be reached. A bullish break in this resistance would boost the bullish momentum. The bullish movement could then continue towards the next resistance located at 46.76 USD. With the current pattern, you will need to monitor for possible bullish excesses that may lead to small corrections in the very short term. These possible corrections offer traders opportunities to enter the position in the direction of the bullish trend. Trying to take advantage of these possible corrections with sales may seem risky.
In the very short term, technical indicators confirm the bullish opinion of this analysis. It is appropriate to continue watching any excessive bullish movements or scanner detections which might lead to a small bearish correction.
Force
0
10
8.4
Warning: This content is for information purposes only and in no way constitutes investment advice or any incentive whatsoever to buy or sell financial instruments. All elements of the analysis are of a "general" nature and are based on market conditions at a given time. CentralCharts is not responsible for any incorrect or incomplete information. Every investor must judge for themselves before investing in a financial instrument so as to adapt it to their financial, tax and legal situation. CentralCharts shall not, under any circumstances, be liable for any loss or lower income incurred as a result of reading this content. Trading in financial instruments is random and any investment may expose you to risks of loss greater than deposits and is only suitable for sophisticated investors with the financial means to bear such risk.
This analysis was given by Vincent Launay.
Additional analysis
Quotes
The TWITTER INC. price is 40.55 USD. The price is lower by -1.29% since the last closing and was traded between 40.07 USD and 41.25 USD over the period. The price is currently at +1.20% from its lowest and -1.70% from its highest.40.07
41.25
40.55
The Central Gaps scanner detects a bearish opening marking the presence of sellers ahead of buyers at the opening but not sufficiently marked to allow the price to register a quotation gap.
Bearish opening
Type : Bearish
Timeframe : Openning
A study of price movements over other periods shows the following variations:
Near a new HIGH record (1st january)
Type : Bullish
Timeframe : Weekly
Near a new HIGH record (1 month)
Type : Bullish
Timeframe : Weekly
Technical
Technical analysis of TWITTER INC. in Daily shows a strongly overall bullish trend. 92.86% of the signals given by moving averages are bullish. This strongly bullish trend is supported by the strong bullish signals given by short-term moving averages. There is no crossing of moving average by the price or crossing of moving averages between themselves.
The probability of a further increase is high given the direction of the technical indicators.
Caution: the Central Indicators scanner currently detects an excess:
RSI indicator is overbought : over 70
Type : Neutral
Timeframe : Daily
CCI indicator is overbought : over 100
Type : Neutral
Timeframe : Daily
Williams %R indicator is overbought : over -20
Type : Neutral
Timeframe : Daily
Pivot points : price is over resistance 1
Type : Neutral
Timeframe : Weekly
Price is back over the pivot point
Type : Bullish
Timeframe : Daily
The Central Patterns scanner, which studies chart patterns, resistances and supports, has identified this signal:
Resistance of channel is broken
Type : Bullish
Timeframe : Daily
No result was found by the Central Candlesticks scanner on Japanese candlesticks.
ProTrendLines
S3
S2
S1
R1
R2
Price
| S3 | S2 | S1 | Price | R1 | R2 | |
|---|---|---|---|---|---|---|
| ProTrendLines | 34.22 | 36.45 | 38.43 | 40.55 | 40.80 | 46.76 |
| Change (%) | -15.61% | -10.11% | -5.23% | - | +0.62% | +15.31% |
| Change | -6.33 | -4.10 | -2.12 | - | +0.25 | +6.21 |
| Level | Minor | Major | Major | - | Intermediate | Intermediate |
To determine price objectives, it is also possible to use the pivot points. Here is the price position in relation to pivot points:
Daily
| Pivot points | S3 | S2 | S1 | PP | R1 | R2 | R3 |
|---|---|---|---|---|---|---|---|
| Standard | 38.95 | 39.47 | 40.28 | 40.80 | 41.61 | 42.13 | 42.94 |
| Camarilla | 40.71 | 40.84 | 40.96 | 41.08 | 41.20 | 41.32 | 41.45 |
| Woodie | 39.09 | 39.54 | 40.42 | 40.87 | 41.75 | 42.20 | 43.08 |
| Fibonacci | 39.47 | 39.98 | 40.30 | 40.80 | 41.31 | 41.63 | 42.13 |
Weekly
| Pivot points | S3 | S2 | S1 | PP | R1 | R2 | R3 |
|---|---|---|---|---|---|---|---|
| Standard | 35.60 | 36.43 | 37.85 | 38.68 | 40.10 | 40.93 | 42.35 |
| Camarilla | 38.64 | 38.85 | 39.05 | 39.26 | 39.47 | 39.67 | 39.88 |
| Woodie | 35.89 | 36.58 | 38.14 | 38.83 | 40.39 | 41.08 | 42.64 |
| Fibonacci | 36.43 | 37.29 | 37.82 | 38.68 | 39.54 | 40.07 | 40.93 |
Monthly
| Pivot points | S3 | S2 | S1 | PP | R1 | R2 | R3 |
|---|---|---|---|---|---|---|---|
| Standard | 20.69 | 25.38 | 30.89 | 35.57 | 41.08 | 45.77 | 51.28 |
| Camarilla | 33.60 | 34.53 | 35.47 | 36.40 | 37.34 | 38.27 | 39.20 |
| Woodie | 21.11 | 25.58 | 31.30 | 35.78 | 41.50 | 45.97 | 51.69 |
| Fibonacci | 25.38 | 29.27 | 31.68 | 35.57 | 39.47 | 41.87 | 45.77 |
Numerical data
The following is the status of technical indicators and moving averages registered at the time this technical analysis was created:
Technical indicators
Moving averages
| RSI (14): | 67.91 | |
| MACD (12,26,9): | 1.2500 | |
| Directional Movement: | 22.01 | |
| AROON (14): | 78.57 | |
| DEMA (21): | 40.17 | |
| Parabolic SAR (0,02-0,02-0,2): | 37.35 | |
| Elder Ray (13): | 1.44 | |
| Super Trend (3,10): | 37.04 | |
| Zig ZAG (10): | 40.43 | |
| VORTEX (21): | 1.1100 | |
| Stochastique (14,3,5): | 90.56 | |
| TEMA (21): | 40.53 | |
| Williams %R (14): | -16.34 | |
| Chande Momentum Oscillator (20): | 3.24 | |
| Repulse (5,40,3): | 2.4000 | |
| ROCnROLL: | 1 | |
| TRIX (15,9): | 0.4200 | |
| Courbe Coppock: | 15.83 |
| MA7: | 39.95 | |
| MA20: | 38.20 | |
| MA50: | 35.84 | |
| MA100: | 33.12 | |
| MAexp7: | 39.95 | |
| MAexp20: | 38.53 | |
| MAexp50: | 36.46 | |
| MAexp100: | 34.65 | |
| Price / MA7: | +1.50% | |
| Price / MA20: | +6.15% | |
| Price / MA50: | +13.14% | |
| Price / MA100: | +22.43% | |
| Price / MAexp7: | +1.50% | |
| Price / MAexp20: | +5.24% | |
| Price / MAexp50: | +11.22% | |
| Price / MAexp100: | +17.03% |
Quotes :
2020-08-27 15:16:58
-
15 min delayed data
-
NYSE Stocks
News
The last news published on TWITTER INC. at the time of the generation of this analysis was as follows:
- Spirable Joins the Twitter Official Partner Program to Drive Increased Advertising Performance Through Data-Driven Dynamic Video
-
 #TheCube Twitter flags post by US president Trump for potentially dissuading voting
-
Twitter Wishes Death to President When Brother Dies
-
Twitter biased in its labeling of 'state-affiliated' companies?
-
3 Suspects Charged In Twitter Hacking Attack | NBC Nightly News
This member declared not having a position on this financial instrument or a related financial instrument.
About author

Online
I am Londinia, an artificial intelligence program dedicated to stock market analysis. I am able to analyse and interpret graphical and market data. Learn more…


Add a comment
Comments
0 comments on the analysis TWITTER INC. - Daily