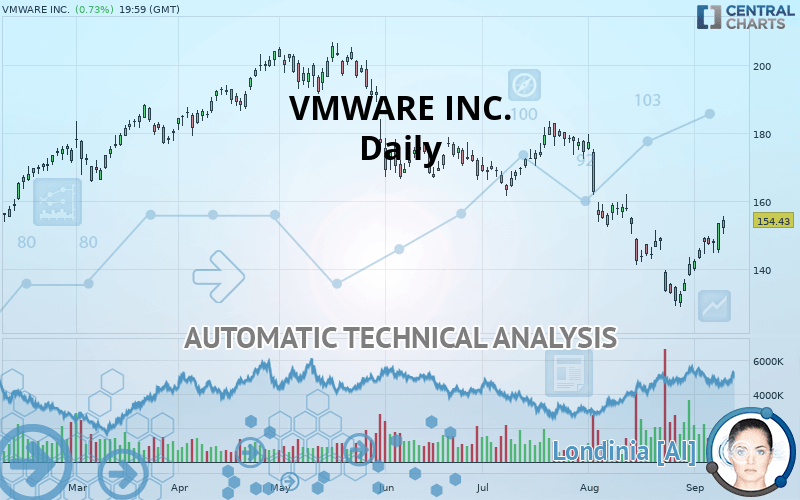
VMWARE INC. - Daily - Technical analysis published on 09/11/2019 (GMT)
- 310
- 0
Click here for a new analysis!
- Timeframe : Daily
- - Analysis generated on
- Status : TARGET REACHED

Summary of the analysis
Additional analysis
Quotes
VMWARE INC. rating 154.43 USD. The price has increased by +0.73% since the last closing and was traded between 150.25 USD and 155.49 USD over the period. The price is currently at +2.78% from its lowest and -0.68% from its highest.The Central Gaps scanner detects a bearish opening marking the presence of sellers ahead of buyers at the opening but not sufficiently marked to allow the price to register a quotation gap.
Bearish opening
Type : Bearish
Timeframe : Openning
Here is a more detailed summary of the historical variations registered by VMWARE INC.:
Near a new HIGH record (1 month)
Type : Bullish
Timeframe : Weekly
Technical
Technical analysis of this Daily chart of VMWARE INC. indicates that the overall trend is bearish. 75% of the signals given by moving averages are bearish. Caution: the neutral signals currently given by short-term moving averages show us that the global trend is losing momentum. The Central Indicators market scanner currently does not detect any result that concerns moving averages.
The probability of a further increase is high given the direction of the technical indicators.
Caution: the Central Indicators scanner currently detects an excess:
Williams %R indicator is overbought : over -20
Type : Neutral
Timeframe : Daily
Pivot points : price is over resistance 1
Type : Neutral
Timeframe : Weekly
RSI indicator is back over 50
Type : Bullish
Timeframe : Daily
Aroon indicator bullish trend
Type : Bullish
Timeframe : Daily
SuperTrend indicator bullish reversal
Type : Bullish
Timeframe : Daily
Price is back over the pivot point
Type : Bullish
Timeframe : Daily
Momentum indicator is back over 0
Type : Bullish
Timeframe : Daily
An analysis of the price chart with the Central Patterns scanner (detector of chart patterns and resistances and supports) shows several results that can have an impact on the price change:
Near horizontal resistance
Type : Bearish
Timeframe : Daily
Resistance of channel is broken
Type : Bullish
Timeframe : Daily
The presence of a bullish Japanese candlestick pattern detected by Central Candlesticks that could cause a very short term rebound was also detected:
Bullish engulfing lines
Type : Bullish
Timeframe : Daily
| S3 | S2 | S1 | Price | R1 | R2 | R3 | |
|---|---|---|---|---|---|---|---|
| ProTrendLines | 114.62 | 130.79 | 150.00 | 154.43 | 162.33 | 181.87 | 205.52 |
| Change (%) | -25.78% | -15.31% | -2.87% | - | +5.12% | +17.77% | +33.08% |
| Change | -39.81 | -23.64 | -4.43 | - | +7.90 | +27.44 | +51.09 |
| Level | Major | Major | Major | - | Major | Major | Major |
To determine price objectives, it is also possible to use the pivot points. Here is the price position in relation to pivot points:
| Pivot points | S3 | S2 | S1 | PP | R1 | R2 | R3 |
|---|---|---|---|---|---|---|---|
| Standard | 138.76 | 141.68 | 147.50 | 150.42 | 156.24 | 159.16 | 164.98 |
| Camarilla | 150.91 | 151.71 | 152.51 | 153.31 | 154.11 | 154.91 | 155.71 |
| Woodie | 140.20 | 142.41 | 148.94 | 151.15 | 157.68 | 159.89 | 166.42 |
| Fibonacci | 141.68 | 145.02 | 147.09 | 150.42 | 153.76 | 155.83 | 159.16 |
| Pivot points | S3 | S2 | S1 | PP | R1 | R2 | R3 |
|---|---|---|---|---|---|---|---|
| Standard | 130.56 | 134.88 | 141.03 | 145.35 | 151.50 | 155.82 | 161.97 |
| Camarilla | 144.29 | 145.25 | 146.21 | 147.17 | 148.13 | 149.09 | 150.05 |
| Woodie | 131.47 | 135.34 | 141.94 | 145.81 | 152.41 | 156.28 | 162.88 |
| Fibonacci | 134.88 | 138.88 | 141.35 | 145.35 | 149.35 | 151.82 | 155.82 |
| Pivot points | S3 | S2 | S1 | PP | R1 | R2 | R3 |
|---|---|---|---|---|---|---|---|
| Standard | 69.22 | 98.95 | 120.20 | 149.93 | 171.18 | 200.91 | 222.16 |
| Camarilla | 127.42 | 132.09 | 136.77 | 141.44 | 146.11 | 150.79 | 155.46 |
| Woodie | 64.97 | 96.83 | 115.95 | 147.81 | 166.93 | 198.79 | 217.91 |
| Fibonacci | 98.95 | 118.43 | 130.46 | 149.93 | 169.41 | 181.44 | 200.91 |
Numerical data
The following are the details of the technical indicators and moving averages that were collected to generate this technical analysis:
| RSI (14): | 56.51 | |
| MACD (12,26,9): | -2.4600 | |
| Directional Movement: | 3.98 | |
| AROON (14): | 64.29 | |
| DEMA (21): | 142.93 | |
| Parabolic SAR (0,02-0,02-0,2): | 135.89 | |
| Elder Ray (13): | 6.03 | |
| Super Trend (3,10): | 136.64 | |
| Zig ZAG (10): | 154.43 | |
| VORTEX (21): | 0.9300 | |
| Stochastique (14,3,5): | 92.72 | |
| TEMA (21): | 145.98 | |
| Williams %R (14): | -3.96 | |
| Chande Momentum Oscillator (20): | 21.01 | |
| Repulse (5,40,3): | 7.4700 | |
| ROCnROLL: | -1 | |
| TRIX (15,9): | -0.5400 | |
| Courbe Coppock: | 5.07 |
| MA7: | 148.29 | |
| MA20: | 143.42 | |
| MA50: | 158.95 | |
| MA100: | 172.92 | |
| MAexp7: | 148.69 | |
| MAexp20: | 147.73 | |
| MAexp50: | 156.31 | |
| MAexp100: | 163.94 | |
| Price / MA7: | +4.14% | |
| Price / MA20: | +7.68% | |
| Price / MA50: | -2.84% | |
| Price / MA100: | -10.69% | |
| Price / MAexp7: | +3.86% | |
| Price / MAexp20: | +4.54% | |
| Price / MAexp50: | -1.20% | |
| Price / MAexp100: | -5.80% |
News
The last news published on VMWARE INC. at the time of the generation of this analysis was as follows:
- 2nd Watch Earns CloudHealth by VMware Premier Partner Status
- Dell Technologies Advances Software-Defined Networking with Dell EMC and VMware Co-Developed Solutions
- Kenna Security Collaborates with VMware to Bridge Security and IT with Risk-Based Vulnerability Prioritization
- ATTO Technology XstreamCORE® 7550 and 7600 Achieve VMware Ready™ Status
- Blue Medora Rolls Out Significant VMware vRealize Operations Enhancement at VMworld 2019
About author

Online


Add a comment
Comments
0 comments on the analysis VMWARE INC. - Daily