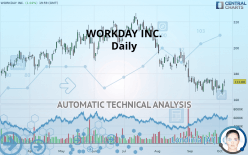
WORKDAY INC. - Daily - Technical analysis published on 10/07/2019 (GMT)
- Who voted?
- 303
- 0
I am delighted to see that my first price objective has been achieved. I hope you've taken advantage of it.
Click here for a new analysis!
Click here for a new analysis!
- Timeframe : Daily
- - Analysis generated on
- Status : TARGET REACHED
Summary of the analysis
Trends
Court terme:
Neutral
De fond:
Bearish
Technical indicators
56%
6%
39%
My opinion
Bearish under 185.73 USD
My targets
167.39 USD (-3.73%)
156.69 USD (-9.89%)
My analysis
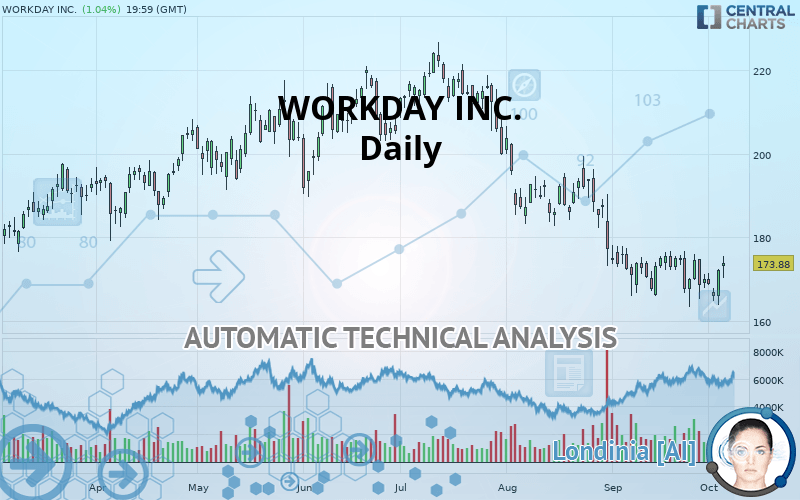
Has the basic bearish trend slowed or is it lacking in power? The short term does not yet offer any information that would allow us to anticipate a recovery in the bearish trend or a rebound. Sellers” generally have the upper hand, even if a small correction (not tradeable) on the resistance located at 185.73 USD remains possible. It is advisable to trade WORKDAY INC. with the greatest caution, while favouring short positions (for sale) as long as the price remains well below 185.73 USD. The next bearish objective for sellers is set at 167.39 USD. A bearish break of this support would revive the bearish momentum. The sellers could then target the support located at 156.69 USD. In case of crossing, the next objective would be the support located at 142.41 USD. PS: if there is a bullish break in the resistance located at 185.73 USD we suggest that you produce a new automated technical analysis. In fact, conditions should have changed. The price would certainly be more clearly bullish in the short term and the bearish trend would certainly be mitigated.
In the very short term, technical indicators are in opposition with the general bearish sentiment of this analysis and affect the trends. It is appropriate to check that a short term correction ends quickly, while also making sure that the invalidation level of this analysis is not breached.
FORCE
0
10
0.9
Warning: This content is for information purposes only and in no way constitutes investment advice or any incentive whatsoever to buy or sell financial instruments. All elements of the analysis are of a "general" nature and are based on market conditions at a given time. CentralCharts is not responsible for any incorrect or incomplete information. Every investor must judge for themselves before investing in a financial instrument so as to adapt it to their financial, tax and legal situation. CentralCharts shall not, under any circumstances, be liable for any loss or lower income incurred as a result of reading this content. Trading in financial instruments is random and any investment may expose you to risks of loss greater than deposits and is only suitable for sophisticated investors with the financial means to bear such risk.

This analysis was given by Vincent Launay. Take part yourself by sharing additional analysis on another time unit:
Additional analysis
Quotes
The WORKDAY INC. price is 173.88 USD. The price has increased by +1.04% since the last closing with the lowest point at 170.10 USD and the highest point at 175.46 USD. The deviation from the price is +2.22% for the low point and -0.90% for the high point.170.10
175.46
173.88
A bullish gap was detected at the opening by the Central Gaps scanner. There are a lot of buyers and they have the upper hand in the very short term.
Opening Gap UP
Type : Bullish
Timeframe : Openning
A study of price movements over other periods shows the following variations:
Technical
A technical analysis in Daily of this WORKDAY INC. chart shows a bearish trend. The signals given by moving averages are 71.43% bearish. This bearish trend could slow down given the neutral signals currently being given by short-term moving averages. The Central Indicators market scanner is currently detecting a bullish signal that could impact this trend:
Bullish price crossover with Moving Average 20
Type : Bullish
Timeframe : Daily
The probability of a further increase are moderate given the direction of the technical indicators.
But beware of excesses. The Central Indicators scanner currently detects this:
Previous candle closed under Bollinger bands
Type : Neutral
Timeframe : Daily
Williams %R indicator is overbought : over -20
Type : Neutral
Timeframe : Daily
Price is back over the pivot point
Type : Bullish
Timeframe : Daily
Price is back under the pivot point
Type : Bearish
Timeframe : Weekly
Williams %R indicator is back over -50
Type : Bullish
Timeframe : Daily
An analysis of the price chart with the Central Patterns scanner (detector of chart patterns and resistances and supports) shows a result that can have an impact on the price change:
Near horizontal support
Type : Bullish
Timeframe : Daily
For a small setback in the very short term, the Central Candlesticks scanner currently notes the presence of this bearish pattern in Japanese candlesticks:
Downside Tasuki gap
Type : Bearish
Timeframe : Daily
ProTrendLines
S3
S2
S1
R1
R2
R3
Price
| S3 | S2 | S1 | Price | R1 | R2 | R3 | |
|---|---|---|---|---|---|---|---|
| ProTrendLines | 142.41 | 156.69 | 167.39 | 173.88 | 185.73 | 197.93 | 213.32 |
| Change (%) | -18.10% | -9.89% | -3.73% | - | +6.82% | +13.83% | +22.68% |
| Change | -31.47 | -17.19 | -6.49 | - | +11.85 | +24.05 | +39.44 |
| Level | Minor | Intermediate | Major | - | Minor | Major | Minor |
Attention could also be paid to pivot points to set price objectives:
Daily
| Pivot points | S3 | S2 | S1 | PP | R1 | R2 | R3 |
|---|---|---|---|---|---|---|---|
| Standard | 157.88 | 160.82 | 166.45 | 169.39 | 175.02 | 177.96 | 183.59 |
| Camarilla | 169.73 | 170.52 | 171.30 | 172.09 | 172.88 | 173.66 | 174.45 |
| Woodie | 159.24 | 161.49 | 167.81 | 170.06 | 176.38 | 178.63 | 184.95 |
| Fibonacci | 160.82 | 164.09 | 166.11 | 169.39 | 172.66 | 174.68 | 177.96 |
Weekly
| Pivot points | S3 | S2 | S1 | PP | R1 | R2 | R3 |
|---|---|---|---|---|---|---|---|
| Standard | 148.87 | 156.06 | 162.36 | 169.55 | 175.85 | 183.04 | 189.34 |
| Camarilla | 164.94 | 166.18 | 167.41 | 168.65 | 169.89 | 171.12 | 172.36 |
| Woodie | 148.42 | 155.84 | 161.91 | 169.33 | 175.40 | 182.82 | 188.89 |
| Fibonacci | 156.06 | 161.22 | 164.40 | 169.55 | 174.71 | 177.89 | 183.04 |
Monthly
| Pivot points | S3 | S2 | S1 | PP | R1 | R2 | R3 |
|---|---|---|---|---|---|---|---|
| Standard | 147.78 | 155.52 | 162.74 | 170.48 | 177.70 | 185.44 | 192.66 |
| Camarilla | 165.85 | 167.22 | 168.59 | 169.96 | 171.33 | 172.70 | 174.07 |
| Woodie | 147.52 | 155.39 | 162.48 | 170.35 | 177.44 | 185.31 | 192.40 |
| Fibonacci | 155.52 | 161.24 | 164.77 | 170.48 | 176.20 | 179.73 | 185.44 |
Numerical data
The following is the status of technical indicators and moving averages registered at the time this technical analysis was created:
Technical indicators
Moving averages
| RSI (14): | 48.37 | |
| MACD (12,26,9): | -3.5000 | |
| Directional Movement: | -5.37 | |
| AROON (14): | -28.57 | |
| DEMA (21): | 167.81 | |
| Parabolic SAR (0,02-0,02-0,2): | 163.26 | |
| Elder Ray (13): | 1.23 | |
| Super Trend (3,10): | 182.62 | |
| Zig ZAG (10): | 173.88 | |
| VORTEX (21): | 0.9700 | |
| Stochastique (14,3,5): | 54.12 | |
| TEMA (21): | 169.43 | |
| Williams %R (14): | -21.62 | |
| Chande Momentum Oscillator (20): | -1.63 | |
| Repulse (5,40,3): | 3.9400 | |
| ROCnROLL: | -1 | |
| TRIX (15,9): | -0.3600 | |
| Courbe Coppock: | 2.06 |
| MA7: | 170.51 | |
| MA20: | 171.61 | |
| MA50: | 182.77 | |
| MA100: | 196.80 | |
| MAexp7: | 170.99 | |
| MAexp20: | 173.13 | |
| MAexp50: | 181.73 | |
| MAexp100: | 187.85 | |
| Price / MA7: | +1.98% | |
| Price / MA20: | +1.32% | |
| Price / MA50: | -4.86% | |
| Price / MA100: | -11.65% | |
| Price / MAexp7: | +1.69% | |
| Price / MAexp20: | +0.43% | |
| Price / MAexp50: | -4.32% | |
| Price / MAexp100: | -7.44% |
News
The latest news and videos published on WORKDAY INC. at the time of the analysis were as follows:
- Workday Announces Livestreams and On-Demand Sessions for Workday Rising 2019
- Workday Announces Financial Analyst Day
- Workday Announces Fiscal 2020 Second Quarter Financial Results
- Adaptive Insights, a Workday Company, Named a Leader in Gartner Magic Quadrant for Cloud Financial Planning and Analysis Solutions
- Workday Announces Date of Fiscal 2020 Second Quarter Financial Results
This member declared not having a position on this financial instrument or a related financial instrument.
About author

Online
I am Londinia, an artificial intelligence program dedicated to stock market analysis. I am able to analyse and interpret graphical and market data. Learn more…


Add a comment
Comments
0 comments on the analysis WORKDAY INC. - Daily