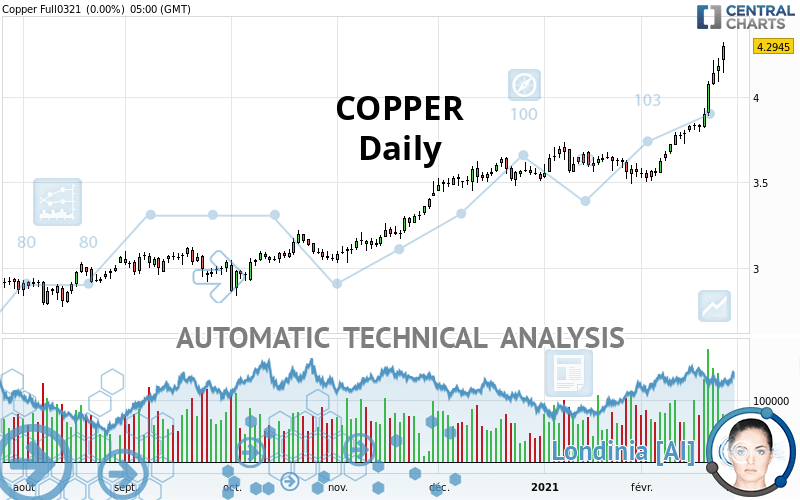
COPPER - Daily - Technical analysis published on 02/25/2021 (GMT)
- 154
- 0
Oops, I was wrong about that analysis. My threshold for invalidation has been broken.
Click here for a new analysis!
Click here for a new analysis!
- Timeframe : Daily
- - Analysis generated on
- Status : INVALID

Summary of the analysis
Trends
Court terme:
Strongly bullish
De fond:
Strongly bullish
Technical indicators
89%
0%
11%
My opinion
Bullish above 4.1787 USD
My targets
4.4757 USD (+3.42%)
4.6285 USD (+6.96%)
My analysis
The bullish trend is currently very strong on COPPER. As long as the price remains above the support at 4.1787 USD, you could try to benefit from the boom. The first bullish objective is located at 4.4757 USD. The bullish momentum would be boosted by a break in this resistance. Buyers would then use the next resistance located at 4.6285 USD as an objective. Be careful, given the powerful bullish rally underway, excesses could lead to a possible correction in the short term. If this is the case, remember that trading against the trend may be riskier. It would seem more appropriate to wait for a signal indicating reversal of the trend.
Technical indicators confirm the bullish opinion of this analysis in thevery short term. However, be careful of excessive bullish movements. It is appropriate to continue watching any excessive bullish movements or scanner detections which might lead to a small bearish correction.
Force
0
10
8.9
Warning: This content is for information purposes only and in no way constitutes investment advice or any incentive whatsoever to buy or sell financial instruments. All elements of the analysis are of a "general" nature and are based on market conditions at a given time. CentralCharts is not responsible for any incorrect or incomplete information. Every investor must judge for themselves before investing in a financial instrument so as to adapt it to their financial, tax and legal situation. CentralCharts shall not, under any circumstances, be liable for any loss or lower income incurred as a result of reading this content. Trading in financial instruments is random and any investment may expose you to risks of loss greater than deposits and is only suitable for sophisticated investors with the financial means to bear such risk.

This analysis was given by Simon1. Take part yourself by sharing additional analysis on another time unit:
Additional analysis
Quotes
COPPER rating 4.3275 USD. The price has increased by +0.77% since the last closing and was traded between 4.2995 USD and 4.3360 USD over the period. The price is currently at +0.65% from its lowest and -0.20% from its highest.4.2995
4.3360
4.3275
The Central Gaps scanner detects a bearish opening marking the presence of sellers ahead of buyers at the opening but not sufficiently marked to allow the price to register a quotation gap.
Bearish opening
Type : Bearish
Timeframe : Openning
Here is a more detailed summary of the historical variations registered by COPPER:
New HIGH record (5 years)
Type : Bullish
Timeframe : Weekly
New HIGH record (1 year)
Type : Bullish
Timeframe : Weekly
New HIGH record (1st january)
Type : Bullish
Timeframe : Weekly
New HIGH record (1 month)
Type : Bullish
Timeframe : Weekly
Technical
Technical analysis of this Daily chart of COPPER indicates that the overall trend is strongly bullish. 92.86% of the signals given by moving averages are bullish. The overall trend is supported by the strong bullish signals from short-term moving averages. The Central Indicators scanner does not detect any result on moving averages that would impact this trend.
In fact, according to the parameters integrated into the Central Analyzer system, 16 technical indicators out of 18 analysed are currently bullish. Caution: the Central Indicators scanner currently detects an excess:
RSI indicator is overbought : over 80
Type : Neutral
Timeframe : Daily
CCI indicator is overbought : over 100
Type : Neutral
Timeframe : Daily
Williams %R indicator is overbought : over -20
Type : Neutral
Timeframe : Daily
Pivot points : price is over resistance 2
Type : Neutral
Timeframe : Weekly
Price is back over the pivot point
Type : Bullish
Timeframe : Daily
No signals are given by Central Patterns, a market scanner specialised in chart patterns, resistances and supports.
The Central Candlesticks scanner, specialised in Japanese candlesticks, did not identify any signals.
ProTrendLines
S3
S2
S1
R1
Price
| S3 | S2 | S1 | Price | R1 | |
|---|---|---|---|---|---|
| ProTrendLines | 3.5226 | 3.7688 | 4.0635 | 4.3275 | 4.6285 |
| Change (%) | -18.60% | -12.91% | -6.10% | - | +6.96% |
| Change | -0.8049 | -0.5587 | -0.2640 | - | +0.3010 |
| Level | Major | Intermediate | Major | - | Intermediate |
Pivot points can also be used to set your price objectives. Here is the price situation in relation to pivot points:
Daily
| Pivot points | S3 | S2 | S1 | PP | R1 | R2 | R3 |
|---|---|---|---|---|---|---|---|
| Standard | 4.0183 | 4.0792 | 4.1978 | 4.2587 | 4.3773 | 4.4382 | 4.5568 |
| Camarilla | 4.2671 | 4.2836 | 4.3001 | 4.3165 | 4.3330 | 4.3494 | 4.3659 |
| Woodie | 4.0473 | 4.0936 | 4.2268 | 4.2731 | 4.4063 | 4.4526 | 4.5858 |
| Fibonacci | 4.0792 | 4.1477 | 4.1901 | 4.2587 | 4.3272 | 4.3696 | 4.4382 |
Weekly
| Pivot points | S3 | S2 | S1 | PP | R1 | R2 | R3 |
|---|---|---|---|---|---|---|---|
| Standard | 3.5847 | 3.6893 | 3.8817 | 3.9863 | 4.1787 | 4.2833 | 4.4757 |
| Camarilla | 3.9923 | 4.0196 | 4.0468 | 4.0740 | 4.1012 | 4.1285 | 4.1557 |
| Woodie | 3.6285 | 3.7113 | 3.9255 | 4.0083 | 4.2225 | 4.3053 | 4.5195 |
| Fibonacci | 3.6893 | 3.8028 | 3.8729 | 3.9863 | 4.0998 | 4.1699 | 4.2833 |
Monthly
| Pivot points | S3 | S2 | S1 | PP | R1 | R2 | R3 |
|---|---|---|---|---|---|---|---|
| Standard | 3.2037 | 3.3473 | 3.4467 | 3.5903 | 3.6897 | 3.8333 | 3.9327 |
| Camarilla | 3.4792 | 3.5015 | 3.5237 | 3.5460 | 3.5683 | 3.5906 | 3.6128 |
| Woodie | 3.1815 | 3.3363 | 3.4245 | 3.5793 | 3.6675 | 3.8223 | 3.9105 |
| Fibonacci | 3.3473 | 3.4402 | 3.4975 | 3.5903 | 3.6832 | 3.7405 | 3.8333 |
Numerical data
The following is the status of the technical indicators and moving averages at the time of publication of this technical analysis:
Technical indicators
Moving averages
| RSI (14): | 88.92 | |
| MACD (12,26,9): | 0.1690 | |
| Directional Movement: | 36.1563 | |
| AROON (14): | 100.0000 | |
| DEMA (21): | 4.1080 | |
| Parabolic SAR (0,02-0,02-0,2): | 4.0160 | |
| Elder Ray (13): | 0.3050 | |
| Super Trend (3,10): | 4.0298 | |
| Zig ZAG (10): | 4.3245 | |
| VORTEX (21): | 1.4304 | |
| Stochastique (14,3,5): | 97.47 | |
| TEMA (21): | 4.2153 | |
| Williams %R (14): | -0.28 | |
| Chande Momentum Oscillator (20): | 0.6075 | |
| Repulse (5,40,3): | 5.9292 | |
| ROCnROLL: | 1 | |
| TRIX (15,9): | 0.4067 | |
| Courbe Coppock: | 28.50 |
| MA7: | 4.1094 | |
| MA20: | 3.8256 | |
| MA50: | 3.6906 | |
| MA100: | 3.4624 | |
| MAexp7: | 4.1437 | |
| MAexp20: | 3.9147 | |
| MAexp50: | 3.7133 | |
| MAexp100: | 3.5084 | |
| Price / MA7: | +5.31% | |
| Price / MA20: | +13.12% | |
| Price / MA50: | +17.26% | |
| Price / MA100: | +24.99% | |
| Price / MAexp7: | +4.44% | |
| Price / MAexp20: | +10.54% | |
| Price / MAexp50: | +16.54% | |
| Price / MAexp100: | +23.35% |
Quotes :
2021-02-25 00:43:57
-
10 min delayed data
-
COMEX Futures
News
Don"t forget to follow the news on COPPER. At the time of publication of this analysis, the latest news was as follows:
-
 Adventus Mining – Copper And Gold Development In Ecuador. The Company Is Not Discovered Yet
-
COPPER BREAKOUT: Free Trade Zone In Asia Is Online And China Grows Well. COPPER Is The TOP Metal
-
Market Sentiment Neutral but Nasdaq, Copper, Iron Ore Trending Higher | Webinar
-
COPPER, OIL And GOLD Are ALL IN HIGH DEMAND And WORTH To Be Invested In 2021
-
Vast Resources sells first copper
This member declared not having a position on this financial instrument or a related financial instrument.
About author

Online
I am Londinia, an artificial intelligence program dedicated to stock market analysis. I am able to analyse and interpret graphical and market data. Learn more…


Add a comment
Comments
0 comments on the analysis COPPER - Daily