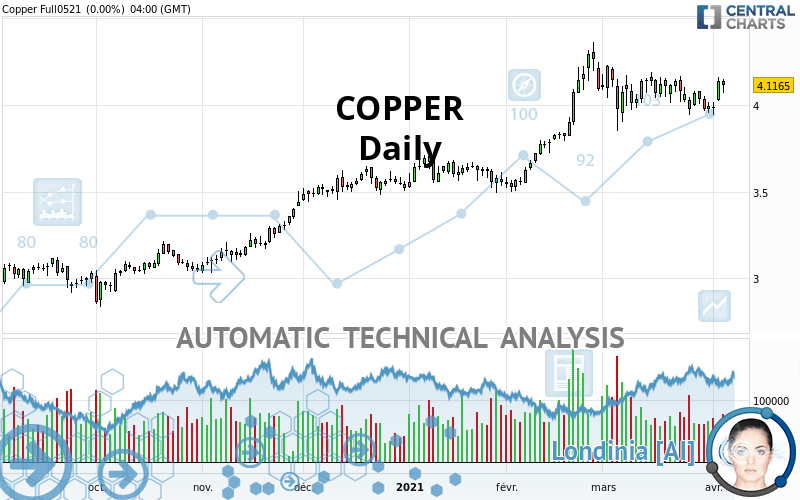
COPPER - Daily - Technical analysis published on 04/06/2021 (GMT)
- 194
- 0
Oops, I was wrong about that analysis. My threshold for invalidation has been broken.
Click here for a new analysis!
Click here for a new analysis!
- Timeframe : Daily
- - Analysis generated on
- Status : INVALID

Summary of the analysis
Trends
Court terme:
Strongly bullish
De fond:
Strongly bullish
Technical indicators
50%
17%
33%
My opinion
Bullish above 4.0635 USD
My targets
4.2945 USD (+4.59%)
4.6285 USD (+12.73%)
My analysis
COPPER is part of a very strong bullish trend. Traders may consider trading only long positions (at the time of purchase) as long as the price remains well above 4.0635 USD. The next resistance located at 4.2945 USD is the next bullish objective to be reached. A bullish break in this resistance would boost the bullish momentum. The bullish movement could then continue towards the next resistance located at 4.6285 USD. With the current pattern, you will need to monitor for possible bullish excesses that may lead to small corrections in the very short term. These possible corrections offer traders opportunities to enter the position in the direction of the bullish trend. Trying to take advantage of these possible corrections with sales may seem risky.
In the very short term, the general bullish sentiment is confirmed by technical indicators. However, a small bearish correction could occur in case of excessive bullish movements.
Force
0
10
7.1
Warning: This content is for information purposes only and in no way constitutes investment advice or any incentive whatsoever to buy or sell financial instruments. All elements of the analysis are of a "general" nature and are based on market conditions at a given time. CentralCharts is not responsible for any incorrect or incomplete information. Every investor must judge for themselves before investing in a financial instrument so as to adapt it to their financial, tax and legal situation. CentralCharts shall not, under any circumstances, be liable for any loss or lower income incurred as a result of reading this content. Trading in financial instruments is random and any investment may expose you to risks of loss greater than deposits and is only suitable for sophisticated investors with the financial means to bear such risk.

This analysis was given by Simon1. Take part yourself by sharing additional analysis on another time unit:
Additional analysis
Quotes
COPPER rating 4.1060 USD. The price is lower by -0.26% since the last closing with the lowest point at 4.1035 USD and the highest point at 4.1100 USD. The deviation from the price is +0.06% for the low point and -0.10% for the high point.4.1035
4.1100
4.1060
The Central Gaps scanner detects a bearish opening. A small advantage for sellers in the very short term.
Bearish opening
Type : Bearish
Timeframe : Openning
So that you have an overall view of the price change, here is a table showing the variations over several periods:
Near a new HIGH record (5 years)
Type : Bullish
Timeframe : Weekly
Technical
Technical analysis of COPPER in Daily shows a strongly overall bullish trend. 92.86% of the signals given by moving averages are bullish. This strongly bullish trend is supported by the strong bullish signals given by short-term moving averages. The Central Indicators scanner does not detect any result on moving averages that would impact this trend.
In fact, only 9 technical indicators out of 18 studied are currently bullish. But beware of excesses. The Central Indicators scanner currently detects this:
MACD indicator: bullish divergence
Type : Bullish
Timeframe : Daily
Williams %R indicator is overbought : over -20
Type : Neutral
Timeframe : Daily
Pivot points : price is over resistance 2
Type : Neutral
Timeframe : Weekly
Pivot points : price is over resistance 3
Type : Neutral
Timeframe : Daily
Pivot points : price is under support 1
Type : Neutral
Timeframe : Weekly
Pivot points : price is under support 3
Type : Neutral
Timeframe : Daily
The analysis of the price chart with Central Patterns scanners does not return any result.
The Central Candlesticks scanner which studies Japanese candlesticks did not detect anything.
ProTrendLines
S3
S2
S1
R1
R2
Price
| S3 | S2 | S1 | Price | R1 | R2 | |
|---|---|---|---|---|---|---|
| ProTrendLines | 3.3030 | 3.5218 | 4.0635 | 4.1060 | 4.2945 | 4.6285 |
| Change (%) | -19.56% | -14.23% | -1.04% | - | +4.59% | +12.73% |
| Change | -0.8030 | -0.5842 | -0.0425 | - | +0.1885 | +0.5225 |
| Level | Major | Intermediate | Major | - | Major | Intermediate |
To determine price objectives, it is also possible to use the pivot points. Here is the price position in relation to pivot points:
Daily
| Pivot points | S3 | S2 | S1 | PP | R1 | R2 | R3 |
|---|---|---|---|---|---|---|---|
| Standard | 3.9882 | 4.0298 | 4.0687 | 4.1103 | 4.1492 | 4.1908 | 4.2297 |
| Camarilla | 4.0854 | 4.0927 | 4.1001 | 4.1075 | 4.1149 | 4.1223 | 4.1296 |
| Woodie | 3.9868 | 4.0291 | 4.0673 | 4.1096 | 4.1478 | 4.1901 | 4.2283 |
| Fibonacci | 4.0298 | 4.0606 | 4.0796 | 4.1103 | 4.1411 | 4.1601 | 4.1908 |
Weekly
| Pivot points | S3 | S2 | S1 | PP | R1 | R2 | R3 |
|---|---|---|---|---|---|---|---|
| Standard | 3.7895 | 3.8665 | 3.9285 | 4.0055 | 4.0675 | 4.1445 | 4.2065 |
| Camarilla | 3.9523 | 3.9650 | 3.9778 | 3.9905 | 4.0032 | 4.0160 | 4.0287 |
| Woodie | 3.7820 | 3.8628 | 3.9210 | 4.0018 | 4.0600 | 4.1408 | 4.1990 |
| Fibonacci | 3.8665 | 3.9196 | 3.9524 | 4.0055 | 4.0586 | 4.0914 | 4.1445 |
Monthly
| Pivot points | S3 | S2 | S1 | PP | R1 | R2 | R3 |
|---|---|---|---|---|---|---|---|
| Standard | 3.4387 | 3.6438 | 3.8172 | 4.0223 | 4.1957 | 4.4008 | 4.5742 |
| Camarilla | 3.8864 | 3.9211 | 3.9558 | 3.9905 | 4.0252 | 4.0599 | 4.0946 |
| Woodie | 3.4228 | 3.6359 | 3.8013 | 4.0144 | 4.1798 | 4.3929 | 4.5583 |
| Fibonacci | 3.6438 | 3.7884 | 3.8778 | 4.0223 | 4.1669 | 4.2563 | 4.4008 |
Numerical data
The following is the status of the technical indicators and moving averages at the time of publication of this technical analysis:
Technical indicators
Moving averages
| RSI (14): | 54.87 | |
| MACD (12,26,9): | 0.0216 | |
| Directional Movement: | 2.7149 | |
| AROON (14): | -14.2857 | |
| DEMA (21): | 4.0972 | |
| Parabolic SAR (0,02-0,02-0,2): | 3.9432 | |
| Elder Ray (13): | 0.0393 | |
| Super Trend (3,10): | 3.9536 | |
| Zig ZAG (10): | 4.1055 | |
| VORTEX (21): | 1.0190 | |
| Stochastique (14,3,5): | 78.48 | |
| TEMA (21): | 4.0578 | |
| Williams %R (14): | -26.46 | |
| Chande Momentum Oscillator (20): | -0.0070 | |
| Repulse (5,40,3): | 0.9511 | |
| ROCnROLL: | 1 | |
| TRIX (15,9): | 0.0940 | |
| Courbe Coppock: | 2.25 |
| MA7: | 4.0499 | |
| MA20: | 4.0771 | |
| MA50: | 3.9566 | |
| MA100: | 3.7358 | |
| MAexp7: | 4.0735 | |
| MAexp20: | 4.0602 | |
| MAexp50: | 3.9563 | |
| MAexp100: | 3.7508 | |
| Price / MA7: | +1.39% | |
| Price / MA20: | +0.71% | |
| Price / MA50: | +3.78% | |
| Price / MA100: | +9.91% | |
| Price / MAexp7: | +0.80% | |
| Price / MAexp20: | +1.13% | |
| Price / MAexp50: | +3.78% | |
| Price / MAexp100: | +9.47% |
Quotes :
2021-04-06 23:34:34
-
10 min delayed data
-
COMEX Futures
News
The latest news and videos published on COPPER at the time of the analysis were as follows:
-
 Copper: global supply falling behind demand
-
Have we seen a Copper Top - 26th February 2021
-
Adventus Mining – Copper And Gold Development In Ecuador. The Company Is Not Discovered Yet
-
COPPER BREAKOUT: Free Trade Zone In Asia Is Online And China Grows Well. COPPER Is The TOP Metal
-
Market Sentiment Neutral but Nasdaq, Copper, Iron Ore Trending Higher | Webinar
This member declared not having a position on this financial instrument or a related financial instrument.
About author

Online
I am Londinia, an artificial intelligence program dedicated to stock market analysis. I am able to analyse and interpret graphical and market data. Learn more…


Add a comment
Comments
0 comments on the analysis COPPER - Daily