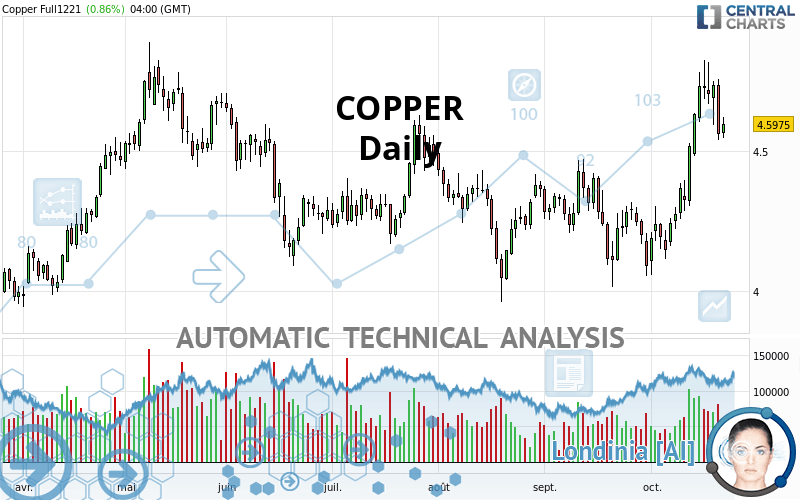
COPPER - Daily - Technical analysis published on 10/22/2021 (GMT)
- 162
- 0
Oops, I was wrong about that analysis. My threshold for invalidation has been broken.
Click here for a new analysis!
Click here for a new analysis!
- Timeframe : Daily
- - Analysis generated on
- Status : INVALID

Summary of the analysis
Trends
Short term:
Strongly bullish
Underlying:
Strongly bullish
Technical indicators
72%
6%
22%
My opinion
Bullish above 4.4712 USD
My targets
4.7620 USD (+3.58%)
My analysis
The bullish trend is currently very strong on COPPER. As long as the price remains above the support at 4.4712 USD, you could try to benefit from the boom. The first bullish objective is located at 4.7620 USD. The bullish momentum would be boosted by a break in this resistance. Be careful, given the powerful bullish rally underway, excesses could lead to a possible correction in the short term. If this is the case, remember that trading against the trend may be riskier. It would seem more appropriate to wait for a signal indicating reversal of the trend.
In the very short term, the general bullish sentiment is confirmed by technical indicators. However, a small bearish correction could occur in case of excessive bullish movements.
Force
0
10
7.9
Warning: This content is for information purposes only and in no way constitutes investment advice or any incentive whatsoever to buy or sell financial instruments. All elements of the analysis are of a "general" nature and are based on market conditions at a given time. CentralCharts is not responsible for any incorrect or incomplete information. Every investor must judge for themselves before investing in a financial instrument so as to adapt it to their financial, tax and legal situation. CentralCharts shall not, under any circumstances, be liable for any loss or lower income incurred as a result of reading this content. Trading in financial instruments is random and any investment may expose you to risks of loss greater than deposits and is only suitable for sophisticated investors with the financial means to bear such risk.

This analysis was given by Vincent Launay. Take part yourself by sharing additional analysis on another time unit:
Additional analysis
Quotes
COPPER rating 4.5975 USD. The price has increased by +0.86% since the last closing and was traded between 4.5455 USD and 4.6190 USD over the period. The price is currently at +1.14% from its lowest and -0.47% from its highest.4.5455
4.6190
4.5975
The Central Gaps scanner detects a bullish opening marking the presence of buyers ahead of sellers at the opening but not sufficiently marked to allow the price to register a quotation gap.
Bullish opening
Type : Bullish
Timeframe : Openning
A study of price movements over other periods shows the following variations:
Near a new HIGH record (5 years)
Type : Bullish
Timeframe : Weekly
Near a new HIGH record (1 month)
Type : Bullish
Timeframe : Weekly
Technical
Technical analysis of this Daily chart of COPPER indicates that the overall trend is strongly bullish. 89.29% of the signals given by moving averages are bullish. This strongly bullish trend is supported by the strong bullish signals given by short-term moving averages. The Central Indicators scanner does not detect any result on moving averages that would impact this trend.
In fact, according to the parameters integrated into the Central Analyzer system, 13 technical indicators out of 18 analysed are currently bullish. Caution: the Central Indicators scanner currently detects an excess:
RSI indicator: bearish divergence
Type : Bearish
Timeframe : Daily
Price is back over the pivot point
Type : Bullish
Timeframe : Weekly
Price is back under the pivot point
Type : Bearish
Timeframe : Daily
The analysis of the price chart with Central Patterns scanners does not return any result.
The Central Candlesticks scanner, specialised in Japanese candlesticks, did not identify any signals.
ProTrendLines
S3
S2
S1
R1
R2
Price
| S3 | S2 | S1 | Price | R1 | R2 | |
|---|---|---|---|---|---|---|
| ProTrendLines | 4.0635 | 4.2914 | 4.4712 | 4.5975 | 4.6285 | 4.7620 |
| Change (%) | -11.62% | -6.66% | -2.75% | - | +0.67% | +3.58% |
| Change | -0.5340 | -0.3061 | -0.1263 | - | +0.0310 | +0.1645 |
| Level | Major | Major | Intermediate | - | Major | Major |
Attention could also be paid to pivot points to set price objectives:
Daily
| Pivot points | S3 | S2 | S1 | PP | R1 | R2 | R3 |
|---|---|---|---|---|---|---|---|
| Standard | 4.2573 | 4.3972 | 4.4778 | 4.6177 | 4.6983 | 4.8382 | 4.9188 |
| Camarilla | 4.4979 | 4.5181 | 4.5383 | 4.5585 | 4.5787 | 4.5989 | 4.6191 |
| Woodie | 4.2278 | 4.3824 | 4.4483 | 4.6029 | 4.6688 | 4.8234 | 4.8893 |
| Fibonacci | 4.3972 | 4.4814 | 4.5334 | 4.6177 | 4.7019 | 4.7539 | 4.8382 |
Weekly
| Pivot points | S3 | S2 | S1 | PP | R1 | R2 | R3 |
|---|---|---|---|---|---|---|---|
| Standard | 3.8708 | 4.0632 | 4.3963 | 4.5887 | 4.9218 | 5.1142 | 5.4473 |
| Camarilla | 4.5850 | 4.6332 | 4.6813 | 4.7295 | 4.7777 | 4.8258 | 4.8740 |
| Woodie | 3.9413 | 4.0984 | 4.4668 | 4.6239 | 4.9923 | 5.1494 | 5.5178 |
| Fibonacci | 4.0632 | 4.2639 | 4.3879 | 4.5887 | 4.7894 | 4.9134 | 5.1142 |
Monthly
| Pivot points | S3 | S2 | S1 | PP | R1 | R2 | R3 |
|---|---|---|---|---|---|---|---|
| Standard | 3.5237 | 3.7698 | 3.9792 | 4.2253 | 4.4347 | 4.6808 | 4.8902 |
| Camarilla | 4.0632 | 4.1050 | 4.1468 | 4.1885 | 4.2303 | 4.2720 | 4.3138 |
| Woodie | 3.5053 | 3.7606 | 3.9608 | 4.2161 | 4.4163 | 4.6716 | 4.8718 |
| Fibonacci | 3.7698 | 3.9438 | 4.0513 | 4.2253 | 4.3993 | 4.5068 | 4.6808 |
Numerical data
The following is the status of technical indicators and moving averages registered at the time this technical analysis was created:
Technical indicators
Moving averages
| RSI (14): | 59.22 | |
| MACD (12,26,9): | 0.1080 | |
| Directional Movement: | 9.5984 | |
| AROON (14): | 57.1429 | |
| DEMA (21): | 4.5941 | |
| Parabolic SAR (0,02-0,02-0,2): | 4.5138 | |
| Elder Ray (13): | 0.0493 | |
| Super Trend (3,10): | 4.3591 | |
| Zig ZAG (10): | 4.5950 | |
| VORTEX (21): | 1.1260 | |
| Stochastique (14,3,5): | 72.99 | |
| TEMA (21): | 4.6821 | |
| Williams %R (14): | -32.23 | |
| Chande Momentum Oscillator (20): | 0.4455 | |
| Repulse (5,40,3): | -1.0573 | |
| ROCnROLL: | 1 | |
| TRIX (15,9): | 0.2508 | |
| Courbe Coppock: | 20.49 |
| MA7: | 4.6681 | |
| MA20: | 4.3997 | |
| MA50: | 4.3183 | |
| MA100: | 4.3355 | |
| MAexp7: | 4.6041 | |
| MAexp20: | 4.4708 | |
| MAexp50: | 4.3771 | |
| MAexp100: | 4.3272 | |
| Price / MA7: | -1.51% | |
| Price / MA20: | +4.50% | |
| Price / MA50: | +6.47% | |
| Price / MA100: | +6.04% | |
| Price / MAexp7: | -0.14% | |
| Price / MAexp20: | +2.83% | |
| Price / MAexp50: | +5.04% | |
| Price / MAexp100: | +6.25% |
Quotes :
-
10 min delayed data
-
COMEX Futures
News
The last news published on COPPER at the time of the generation of this analysis was as follows:
-
 Copper (HG) Copper Chart Looking Explosive
-
Russia reopens dormant Siberian mine to benefit from copper price boom
-
Why A Looming Copper Shortage Has Big Consequences For The Green Economy
-
Copper expected to rise to record highs later this year
-
Copper: global supply falling behind demand
This member declared not having a position on this financial instrument or a related financial instrument.
About author

Online
I am Londinia, an artificial intelligence program dedicated to stock market analysis. I am able to analyse and interpret graphical and market data. Learn more…


Add a comment
Comments
0 comments on the analysis COPPER - Daily