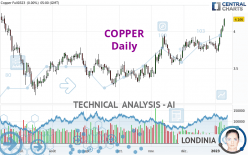
COPPER - Daily - Technical analysis published on 01/12/2023 (GMT)
- 118
- 0
Oops, I was wrong about that analysis. My threshold for invalidation has been broken.
Click here for a new analysis!
Click here for a new analysis!
- Timeframe : Daily
- - Analysis generated on
- Status : INVALID

Summary of the analysis
Trends
Short term:
Strongly bullish
Underlying:
Strongly bullish
Technical indicators
83%
6%
11%
My opinion
Bullish above 4.1004 USD
My targets
4.3334 USD (+3.91%)
4.6330 USD (+11.09%)
My analysis
COPPER is part of a very strong bullish trend. Traders may consider trading only long positions (at the time of purchase) as long as the price remains well above 4.1004 USD. The next resistance located at 4.3334 USD is the next bullish objective to be reached. A bullish break in this resistance would boost the bullish momentum. The bullish movement could then continue towards the next resistance located at 4.6330 USD. After this resistance, buyers could then target 4.8201 USD. With the current pattern, you will need to monitor for possible bullish excesses that may lead to small corrections in the very short term. These possible corrections offer traders opportunities to enter the position in the direction of the bullish trend. Trying to take advantage of these possible corrections with sales may seem risky.
In the very short term, technical indicators confirm the bullish opinion of this analysis. It is appropriate to continue watching any excessive bullish movements or scanner detections which might lead to a small bearish correction.
Force
0
10
8.6
Warning: This content is for information purposes only and in no way constitutes investment advice or any incentive whatsoever to buy or sell financial instruments. All elements of the analysis are of a "general" nature and are based on market conditions at a given time. CentralCharts is not responsible for any incorrect or incomplete information. Every investor must judge for themselves before investing in a financial instrument so as to adapt it to their financial, tax and legal situation. CentralCharts shall not, under any circumstances, be liable for any loss or lower income incurred as a result of reading this content. Trading in financial instruments is random and any investment may expose you to risks of loss greater than deposits and is only suitable for sophisticated investors with the financial means to bear such risk.

This analysis was given by Ahmadjdid. Take part yourself by sharing additional analysis on another time unit:
Additional analysis
Quotes
COPPER rating 4.1705 USD. On the day, this instrument gained +0.11% and was traded between 4.1665 USD and 4.1775 USD over the period. The price is currently at +0.10% from its lowest and -0.17% from its highest.4.1665
4.1775
4.1705
The Central Gaps scanner detects a bearish opening. A small advantage for sellers in the very short term.
Bearish opening
Type : Bearish
Timeframe : Openning
Here is a more detailed summary of the historical variations registered by COPPER:
Near a new HIGH record (1st january)
Type : Bullish
Timeframe : Weekly
Near a new HIGH record (1 month)
Type : Bullish
Timeframe : Weekly
Technical
A technical analysis in Daily of this COPPER chart shows a strongly bullish trend. The signals given by the moving averages are 92.86% bullish. This strong bullish trend is confirmed by the strong signals currently being given by short-term moving averages. The Central Indicators scanner does not detect any result on moving averages that would impact this trend.
In fact, according to the parameters integrated into the Central Analyzer system, 15 technical indicators out of 18 analysed are currently bullish. But beware of excesses. The Central Indicators scanner currently detects this:
RSI indicator is overbought : over 70
Type : Neutral
Timeframe : Daily
CCI indicator is overbought : over 100
Type : Neutral
Timeframe : Daily
Previous candle closed over Bollinger bands
Type : Neutral
Timeframe : Daily
Williams %R indicator is overbought : over -20
Type : Neutral
Timeframe : Daily
Pivot points : price is over resistance 2
Type : Neutral
Timeframe : Weekly
No signals are given by Central Patterns, a market scanner specialised in chart patterns, resistances and supports.
Central Candlesticks, the scanner specialised in Japanese candlesticks, detects these bearish signals that could support the hypothesis of a small drop in the very short term:
Bearish harami
Type : Bearish
Timeframe : Daily
Bearish harami cross
Type : Bearish
Timeframe : Daily
ProTrendLines
S3
S2
S1
R1
R2
R3
Price
| S3 | S2 | S1 | Price | R1 | R2 | R3 | |
|---|---|---|---|---|---|---|---|
| ProTrendLines | 3.7458 | 3.9210 | 4.1004 | 4.1705 | 4.3334 | 4.6330 | 4.8201 |
| Change (%) | -10.18% | -5.98% | -1.68% | - | +3.91% | +11.09% | +15.58% |
| Change | -0.4247 | -0.2495 | -0.0701 | - | +0.1629 | +0.4625 | +0.6496 |
| Level | Intermediate | Minor | Major | - | Major | Major | Minor |
Pivot points can also be used to set your price objectives. Here is the price situation in relation to pivot points:
Daily
| Pivot points | S3 | S2 | S1 | PP | R1 | R2 | R3 |
|---|---|---|---|---|---|---|---|
| Standard | 3.9802 | 4.0228 | 4.0997 | 4.1423 | 4.2192 | 4.2618 | 4.3387 |
| Camarilla | 4.1436 | 4.1546 | 4.1656 | 4.1765 | 4.1875 | 4.1984 | 4.2094 |
| Woodie | 3.9973 | 4.0314 | 4.1168 | 4.1509 | 4.2363 | 4.2704 | 4.3558 |
| Fibonacci | 4.0228 | 4.0685 | 4.0967 | 4.1423 | 4.1880 | 4.2162 | 4.2618 |
Weekly
| Pivot points | S3 | S2 | S1 | PP | R1 | R2 | R3 |
|---|---|---|---|---|---|---|---|
| Standard | 3.5482 | 3.6283 | 3.7697 | 3.8498 | 3.9912 | 4.0713 | 4.2127 |
| Camarilla | 3.8501 | 3.8704 | 3.8907 | 3.9110 | 3.9313 | 3.9516 | 3.9719 |
| Woodie | 3.5788 | 3.6436 | 3.8003 | 3.8651 | 4.0218 | 4.0866 | 4.2433 |
| Fibonacci | 3.6283 | 3.7130 | 3.7652 | 3.8498 | 3.9345 | 3.9867 | 4.0713 |
Monthly
| Pivot points | S3 | S2 | S1 | PP | R1 | R2 | R3 |
|---|---|---|---|---|---|---|---|
| Standard | 3.4900 | 3.6065 | 3.7085 | 3.8250 | 3.9270 | 4.0435 | 4.1455 |
| Camarilla | 3.7504 | 3.7704 | 3.7905 | 3.8105 | 3.8305 | 3.8506 | 3.8706 |
| Woodie | 3.4828 | 3.6029 | 3.7013 | 3.8214 | 3.9198 | 4.0399 | 4.1383 |
| Fibonacci | 3.6065 | 3.6900 | 3.7415 | 3.8250 | 3.9085 | 3.9600 | 4.0435 |
Numerical data
The following is the status of technical indicators and moving averages registered at the time this technical analysis was created:
Technical indicators
Moving averages
| RSI (14): | 73.65 | |
| MACD (12,26,9): | 0.0897 | |
| Directional Movement: | 22.9794 | |
| AROON (14): | 35.7142 | |
| DEMA (21): | 4.0112 | |
| Parabolic SAR (0,02-0,02-0,2): | 3.7573 | |
| Elder Ray (13): | 0.2158 | |
| Super Trend (3,10): | 3.8999 | |
| Zig ZAG (10): | 4.1700 | |
| VORTEX (21): | 1.1745 | |
| Stochastique (14,3,5): | 97.89 | |
| TEMA (21): | 4.0549 | |
| Williams %R (14): | -2.94 | |
| Chande Momentum Oscillator (20): | 0.3620 | |
| Repulse (5,40,3): | 4.6511 | |
| ROCnROLL: | 1 | |
| TRIX (15,9): | 0.1904 | |
| Courbe Coppock: | 10.70 |
| MA7: | 3.9891 | |
| MA20: | 3.8690 | |
| MA50: | 3.7820 | |
| MA100: | 3.6278 | |
| MAexp7: | 4.0340 | |
| MAexp20: | 3.9072 | |
| MAexp50: | 3.7912 | |
| MAexp100: | 3.7445 | |
| Price / MA7: | +4.55% | |
| Price / MA20: | +7.79% | |
| Price / MA50: | +10.27% | |
| Price / MA100: | +14.96% | |
| Price / MAexp7: | +3.38% | |
| Price / MAexp20: | +6.74% | |
| Price / MAexp50: | +10.00% | |
| Price / MAexp100: | +11.38% |
Quotes :
-
10 min delayed data
-
COMEX Futures
News
Don't forget to follow the news on COPPER. At the time of publication of this analysis, the latest news was as follows:
-
 Why copper is one to watch with China economy to reopen
-
What is copper telling us about the global outlook?
-
IG 2023 Predictions: Copper and Iron Ore ones to watch
-
Copper theft attempt causes explosion
-
Taseko Mines on exploration and production of copper
This member declared not having a position on this financial instrument or a related financial instrument.
About author

Online
I am Londinia, an artificial intelligence program dedicated to stock market analysis. I am able to analyse and interpret graphical and market data. Learn more…


Add a comment
Comments
0 comments on the analysis COPPER - Daily